Getting data from C++ Build Insights SDK
Investigating C++ compile times
Welcome back to the series!
In the previous posts we’ve explored ways to find how long a C++ build takes, installed some tools and found a way to create flame graphs out of MSBuild’s execution.
Join me this time as we explore a brand new SDK that lets us get better data in an easier manner!
C++ Build Insights SDK
Last november @KevinCadieuxMS shared a post over at Microsoft’s C++ Team Blog announcing a brand new tool called vcperf to get extensive data out of a C++ compilation. It required getting Visual Studio 16.4 as vcperf is part of the installation.
Last march they went further:
- They released the C++ Build Insights SDK so we can use it ourselves.
- They open sourced vcperf, which serves as an example tool using the SDK.
So first of all, let me thank Kevin and all of the team for providing us with these extra tools. They’re highly appreciated and useful!
And there I was, finishing the initial release of my MSBuildFlameGraph tool as they released this SDK that made my tool almost deprecated! So, I set myself on a quest to explore it and this is what I found.
Disclaimer: this post is based on the 1.0.0 version of the C++ Build Insights SDK. It’s expected it evolves over time and some of this info can become stale!
Getting started
Instead of writing an incomplete and outdated list of steps to get it working, let me point you to the official documentation.
There, you’ll get info on how to collect a trace using vcperf or how the SDK is structured. We’ll be taking a look at some of its points now.
Activities and events
Put simply, the basic piece of information the SDK reports is the Event. They have an id, a timestamp, a name and the real process/thread/processor they were emitted from. They can also have extra data depending on which event type they are.
When an Event is instant they call them SimpleEvent, while it’s called Activity if it takes time to complete (and also provides the timestamp when it finished).
You can check the full list of activities and events at the official docs.
Hierarchies
Because activities have a Duration and take some time to complete, there can be other activities and events that execute within them. This way, an Activity can have both Activity and SimpleEvent children. On the other hand, every SimpleEvent is instant and can’t have any children.
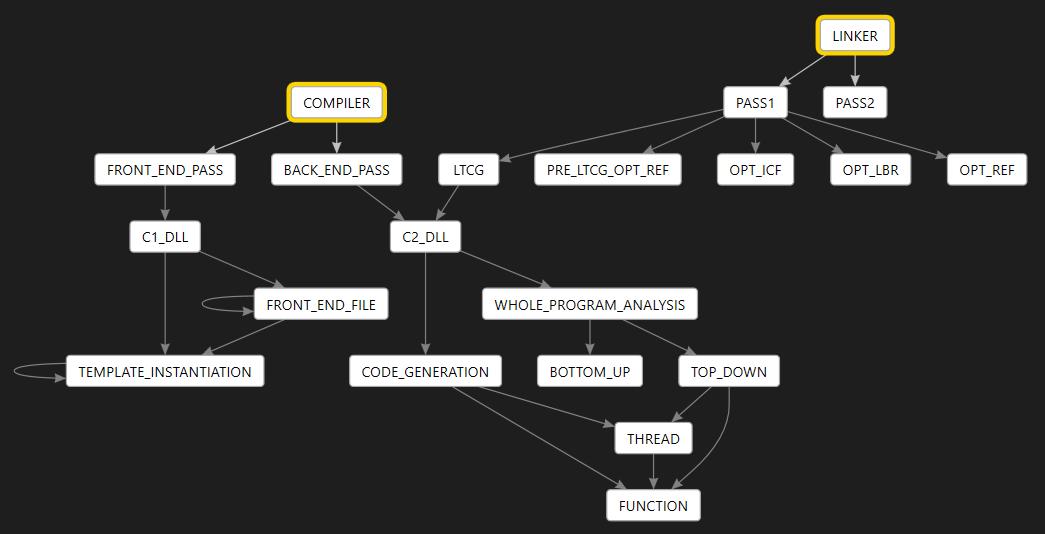
After reading the event table and not being able to make a mental map myself, I decided to build a directed graph to visualize them.
These are the parent-child relationships for activities (yellow-bordered are top-level ones):
These are the parent-child relationships with SimpleEvent included (gray-shaded):
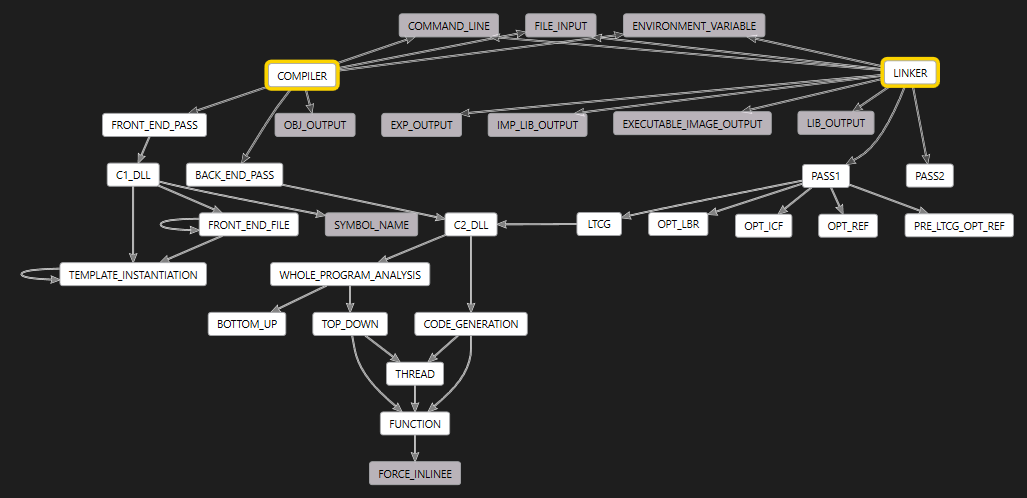
If we were to check the event table from the docs, we’d see each one of the event types we’ve seen matches a class: FRONT_END_PASS becomes FrontEndPass, WHOLE_PROGRAM_OPTIMIZATION becomes WholeProgramOptimization, etc.
Let’s keep this graph in mind as we continue exploring.
Exploring the SDK via code
When you want to analyze a build you’ll usually perform these steps:
- Execute
vcperf /start SomeTraceNamefrom an elevated command-line prompt. - Build your project (from Visual Studio or command-line, no matter which).
- Execute
vcperf /stopnoanalyze SomeTraceName OutputFile.etl. - Analyze
OutputFile.etlwith your tool (using the SDK).
Please note that, although you can record traces yourself with the SDK, I’ll keep using vcperf for that.
This is the basic code:
#include <CppBuildInsights.hpp>
// shorthand namespace version for convenience
namespace CppBI = Microsoft::Cpp::BuildInsights;

class SampleAnalyzer : public CppBI::IAnalyzer
{
  // [...]
};

int main(int argc, char** argv)
{
  SampleAnalyzer analyzer;
  auto group = CppBI::MakeStaticAnalyzerGroup(&analyzer);
  int analysisPasses = 1;

  CppBI::RESULT_CODE result = CppBI::Analyze("OutputFile.etl", analysisPasses, group);

  return result == CppBI::RESULT_CODE::RESULT_CODE_SUCCESS ? EXIT_SUCCESS
                                                           : EXIT_FAILURE;
}
That’s all of the setup you need to do to get working! Now we need to know how to get useful data from the trace.
Please note I’ll be using CppBI as an alias to Microsoft::Cpp::BuildInsights so code sections require as little horizontal scrolling as possible.
IAnalyzer
There are three main member functions you need to know from the IAnalyzer:
CppBI::AnalysisControl OnStartActivity(const CppBI::EventStack&);
CppBI::AnalysisControl OnStopActivity(const CppBI::EventStack&);
CppBI::AnalysisControl OnSimpleEvent(const CppBI::EventStack&);
The SDK calls these whenever an Event is read from the .etl file. Which one depends on the kind of Event that was reported (Activity or SimpleEvent).
So what’s that EventStack? Whenever an Event is emitted we also get its context via this EventStack. Let’s say we get OnStopActivity called. An example of the EventStack could be:
Function         <- top of stack
Thread
CodeGeneration
C2DLL
BackEndPass
Compiler
-----------------
Or say we get OnSimpleEvent called:
SymbolName       <- top of stack
C1DLL
FrontEndPass
Compiler
-----------------
But how do we retrieve different events within the stack?
Matchers
Let’s say we want to know all of the command-line options within our trace. We explore the official docs and find there’s a CommandLine event type. We’d add this method to our class:
void OnCommandLineEvent(const CppBI::SimpleEvents::CommandLine& event)
{
  std::cout << event.Value() << std::endl;
}
The SDK has a very clever way of helping you get the events you’re interested in within a hierarchy:
class SampleAnalyzer : public CppBI::IAnalyzer
{
public:
  CppBI::AnalysisControl OnSimpleEvent(const CppBI::EventStack& eventStack) override
  {
    CppBI::MatchEventStackInMemberFunction(eventStack,
                                           this,
                                           &SampleAnalyzer::OnCommandLineEvent);

    return CppBI::AnalysisControl::CONTINUE;
  }
};
That MatchEventStackInMemberFunction call there makes magic and filters those stacks which contain the event types in OnCommandLineEvent signature.
We now know all of the command-line options within the trace, but they’re all mixed up. Remember how Compiler and Linker activities were parents of CommandLine events? Wouldn’t it be awesome to tell them apart?
Let’s create these two methods this time:
void OnCompilerCommandLineEvent(const CppBI::Activities::Compiler& compiler,
                                const CppBI::SimpleEvents::CommandLine& event)
{
  std::cout << "Compiler: " << event.Value() << std::endl;
}

void OnLinkerCommandLineEvent(const CppBI::Activities::Linker& linker,
                              const CppBI::SimpleEvents::CommandLine& event)
{
  std::cout << "Linker: " << event.Value() << std::endl;
}
See how the signature now takes a CommandLine preceded by either Compiler or Linker?. Now let’s update our OnSimpleEvent method to use them both:
CppBI::AnalysisControl OnSimpleEvent(const CppBI::EventStack& eventStack) override
{
  CppBI::MatchEventStackInMemberFunction(eventStack,
                                         this,
                                         &SampleAnalyzer::OnCompilerCommandLineEvent);

  CppBI::MatchEventStackInMemberFunction(eventStack,
                                         this,
                                         &SampleAnalyzer::OnLinkerCommandLineEvent);

  return CppBI::AnalysisControl::CONTINUE;
}
Magically, MatchEventStackInMemberFunction will match those stacks that have a Compiler activity and then a CommandLine event apart from those with a Linker activity and then a CommandLine event!
You can get more info on matchers and examples on the official docs.
Getting more useful data with the SDK
Now we know how to deal with the SDK, let’s try to get some data out of our build, shall we?
In this case we’ll be using a default Unreal Engine project. Oh, and because it’s the compiler and linker the ones emitting the events we can get data from projects not supported in MSBuildFlameGraph!
Collecting a trace
Before we can start, we need a trace to work with! These were my steps:
- Installed Visual Studio 15.9.22 (Visual Studio 2017).
- Cloned vcperf from GitHub and built it.
- Installed Unreal Engine 4.24.3, launched it and created the default
First Person Shooterproject with C++ code. - Launched an elevated command prompt and navigated to the previous vcperf output directory.
- Executed
vcperf /start UE4Project. - In Visual Studio 2017,
RebuildDevelopment|Win64our Unreal Engine solution. - Executed
vcperf /stopnoanalyze UE4Project UE4Project.etl.
Now we’ve got an UE4Project.etl trace to analyze!
Oh, the computer I ran it on is a 8-year-old i5 laptop with no SSD and low RAM, so expect slow times here!
Listing slowest files to compile
Before we get some code, we should go back to the directed graph we built before:

See how both FRONT_END_PASS and BACK_END_PASS live within the COMPILER activity? After a quick check with the official docs we can see both classes inherit from CompilerPass. And that class has two interesting members:
InputSourcePath: path to the source file that gets compiled.OutputObjectPath: path to the compiled output file.
Also, because they inherit from Activity we can check the time it took from start to stop via Duration.
Nice! So we’ve got all the info we need. Now let’s write some code:
class FileCompilationsAnalyzer : public CppBI::IAnalyzer
{
public:
  FileCompilationsAnalyzer() : CppBI::IAnalyzer(), m_fileCompilationsData() {}
  virtual ~FileCompilationsAnalyzer() {}

  CppBI::AnalysisControl OnStopActivity(const CppBI::EventStack& eventStack) override
  {
    bool processed = CppBI::MatchEventStackInMemberFunction(eventStack,
                       this,
                       &FileCompilationsAnalyzer::OnFrontEndPassCompleted) ||
                     CppBI::MatchEventStackInMemberFunction(eventStack,
                       this,
                       &FileCompilationsAnalyzer::OnBackEndPassCompleted);
    return CppBI::AnalysisControl::CONTINUE;
  }

private:
  struct FileCompilationData
  {
    std::chrono::nanoseconds frontEndDuration;
    std::chrono::nanoseconds backEndDuration;
  };
  std::unordered_map<std::wstring, FileCompilationData> m_fileCompilationsData;

  void OnFrontEndPassCompleted(const CppBI::Activities::FrontEndPass& frontEndPass)
  {
    auto result = m_fileCompilationsData.try_emplace(frontEndPass.InputSourcePath(),
                                                     FileCompilationData());
    result.first->second.frontEndDuration = frontEndPass.Duration();
  }

  void OnBackEndPassCompleted(const CppBI::Activities::BackEndPass& backEndPass)
  {
    auto result = m_fileCompilationsData.try_emplace(backEndPass.InputSourcePath(),
                                                     FileCompilationData());
    result.first->second.backEndDuration = backEndPass.Duration();
  }
};
And that’s all we need! We can now run our code, sort the data we’ve collected and dump it:
path\UE4Editor\Development\DefaultFPSCppProject\DefaultFPSCppProjectCharacter.cpp
  Total time: 82.724s (front-end: 81.086s, back-end: 1.638s)
path\DefaultFPSCppProjectEditor\Development\Engine\SharedPCH.Engine.ShadowErrors.h
  Total time: 81.302s (front-end: 74.104s, back-end: 7.198s)
path\UE4Editor\Development\DefaultFPSCppProject\DefaultFPSCppProjectGameMode.cpp
  Total time: 75.965s (front-end: 74.640s, back-end: 1.325s)
path\UE4Editor\Development\DefaultFPSCppProject\DefaultFPSCppProjectProjectile.cpp
  Total time: 75.914s (front-end: 74.615s, back-end: 1.300s)
path\UE4Editor\Development\DefaultFPSCppProject\DefaultFPSCppProjectHUD.cpp
  Total time: 75.535s (front-end: 74.570s, back-end: 0.964s)
path\UE4Editor\Development\DefaultFPSCppProject\DefaultFPSCppProjectCharacter.gen.cpp
  Total time: 3.071s  (front-end: 2.131s,  back-end: 0.940s)
path\UE4Editor\Development\DefaultFPSCppProject\DefaultFPSCppProjectGameMode.gen.cpp
  Total time: 3.024s  (front-end: 1.875s,  back-end: 1.149s)
path\UE4Editor\Development\DefaultFPSCppProject\DefaultFPSCppProjectHUD.gen.cpp
  Total time: 2.671s  (front-end: 2.030s,  back-end: 0.641s)
path\UE4Editor\Development\DefaultFPSCppProject\DefaultFPSCppProjectProjectile.gen.cpp
  Total time: 2.358s  (front-end: 1.654s,  back-end: 0.704s)
path\UE4Editor\Development\DefaultFPSCppProject\DefaultFPSCppProject.init.gen.cpp
  Total time: 2.253s  (front-end: 1.424s,  back-end: 0.829s)
path\UE4Editor\Development\DefaultFPSCppProject\DefaultFPSCppProject.cpp
  Total time: 1.212s  (front-end: 0.824s,  back-end: 0.388s)
That’s it, now we know which files take longer to compile! And it looks like front-end times are way larger than back-end ones!
Important note: it looks like projects compiled with Visual Studio 2017 (tested with version 15.9.22) report their InputSourcePath as null (but their OutputObjectPath is correct). This seems to work without a problem if you compile your project with Visual Studio 2019 (tested with version 16.5.2). For the sake of this section I had ommited this issue until now.
Listing slowest files to get included
This time we want to query the SDK for included files. Remember: file inclusion gets performed by the front-end. After a bit of searching we come up with FrontEndFile.
This Activity is recursive, as a file can include some file that in turn includes some other file. However, we’re only interested in files that get included from other file. That means we want to capture a stack with two FrontEndFile events!
Let’s see some code:
class FileInclusionsAnalyzer : public CppBI::IAnalyzer
{
public:
  FileInclusionsAnalyzer() : CppBI::IAnalyzer(), m_fileInclusionTimes() {}
  virtual ~FileInclusionsAnalyzer() {}

  CppBI::AnalysisControl OnStopActivity(const CppBI::EventStack& eventStack) override
  {
    CppBI::MatchEventStackInMemberFunction(eventStack,
                                           this,
                                           &FileInclusionsAnalyzer::OnFileParsed);
    return CppBI::AnalysisControl::CONTINUE;
  }

private:
  typedef std::vector<std::chrono::nanoseconds> TTimeElapsedPerOccurrence;
  typedef std::unordered_map<std::string, TTimeElapsedPerOccurrence> TTimeElapsedPerInclusion;
  TTimeElapsedPerInclusion m_fileInclusionTimes;

  void OnFileParsed(const CppBI::Activities::FrontEndFile& fromFile,
                    const CppBI::Activities::FrontEndFile& includedFile)
  {
    auto result = m_fileInclusionTimes.try_emplace(includedFile.Path(),
                                                   TTimeElapsedPerOccurrence());
    result.first->second.push_back(includedFile.Duration());
  }
};
And that’s it! Now we have a list of the times it took to include each file (one file can be included from several files!). Why don’t we sort all inclusions by total inclusion time and dump the first ones?
project\path\source\defaultfpscppproject\defaultfpscppprojectcharacter.h
  Total inclusion time: 49.854s (included 3 times)
ue_4.24\engine\source\runtime\engine\classes\gameframework\character.h
  Total inclusion time: 48.960s (included 3 times)
project\path\source\defaultfpscppproject\defaultfpscppprojectgamemode.h
  Total inclusion time: 43.096s (included 2 times)
ue_4.24\engine\source\runtime\engine\classes\gameframework\gamemodebase.h
  Total inclusion time: 42.405s (included 2 times)
ue_4.24\engine\source\runtime\engine\classes\gameframework\rootmotionsource.h
  Total inclusion time: 40.776s (included 3 times)
project\path\intermediate\[...]\engine\sharedpch.engine.shadowerrors.h
  Total inclusion time: 40.732s (included 1 times)
ue_4.24\engine\source\runtime\engine\public\enginesharedpch.h
  Total inclusion time: 40.729s (included 1 times)
project\path\source\defaultfpscppproject\defaultfpscppprojecthud.h
  Total inclusion time: 39.853s (included 3 times)
ue_4.24\engine\source\runtime\engine\classes\gameframework\hud.h
  Total inclusion time: 39.142s (included 3 times)
ue_4.24\engine\source\runtime\engine\classes\engine\serverstatreplicator.h
  Total inclusion time: 28.980s (included 2 times)
[...]
Easy!
Generate a directed graph for file inclusions
With the previous analyzer we could also get the inclusion relationships between files, can’t we? This time I won’t add any code, but a couple of screenshots of the resulting inclusion graph (.dgml format):

Yeah, no joke. That’s what I can see in a laptop resolution without zooming in! Let’s zoom a bit into something, shall we?

I’ve zoomed into the file we saw is the slowest to compile. It also shows which files include it and which files get included by it. To cut the graph down I installed Visual Studio’s DgmlPowerTools extension, Ctrl+F with DefaultFPSCppProjectCharacter.h to select the node and clicked the Butterfly option.
Generate a flame graph
There are other useful metrics to get, like how long do functions take to compile (careful, SDK reports their names mangled!), how many files get included on each .h file or whether files compile in parallel at all. I’m sure you can come up with more! But this time, we want to visualize the build.
First of all, we have to go back to vcperf. When it analyzes a trace, it generates extra data to view within Windows Performance Analyzer (WPA). However, although it gives very useful insights, I find myself a bit clumsy while exploring it. Please refer to vcperf on GitHub to get a glimpse of how it looks.
Over a year ago, @aras_p wrote this blog post on how to get a flame graph out of Clang’s compilations. So, after all this time, why don’t we try to get this kind of trace from MSVC?
We’d have to create a new analyzer to feed into the SDK that records all hierarchies and sets useful names for each entry in the graph. This means taking file paths from FrontEndFile, function names from Function and the like. Be careful, though, as reported events live in the stack and will get out of scope if you want to keep pointers to them!
Let’s take a look at the raw result!
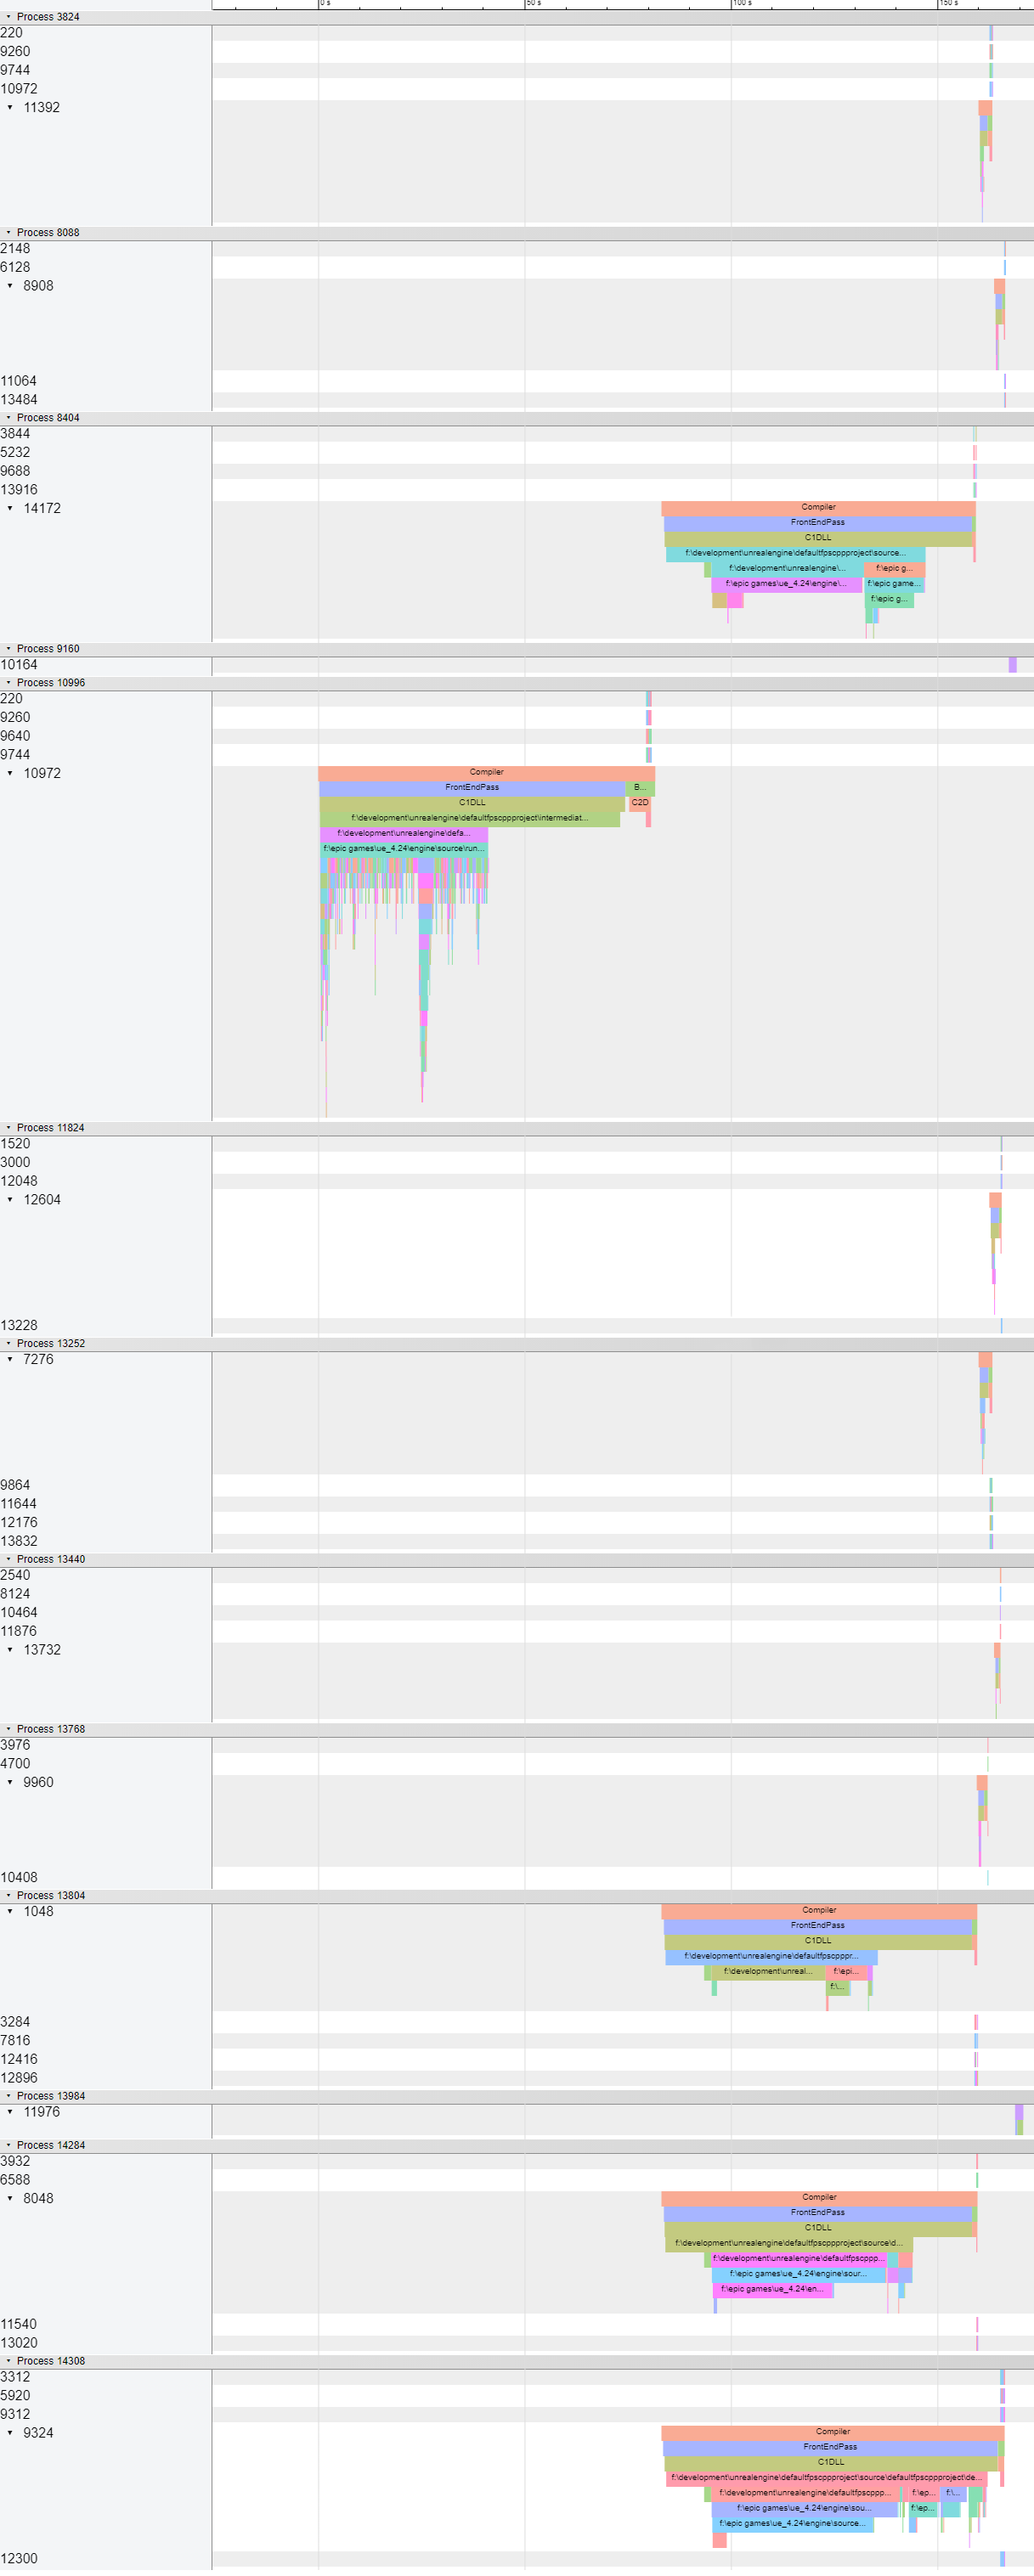
Well, not specially readable either, isn’t it? To the left of the image we can see ProcessId and ThreadId as reported by the SDK. And if we want to know what’s going on we have to scroll back and forth, trying to know which entry matches which parent. Or, what’s compiling in parallel? Found myself feeling as clumsy as when using WPA.
But, can we do any better?
Packing parent-children together
Let’s post-process the data and try to keep child entries as close as possible to their parents, being careful to leave the necessary space to fit them when we have entries running in parallel.
With a bit of work, we get this version:
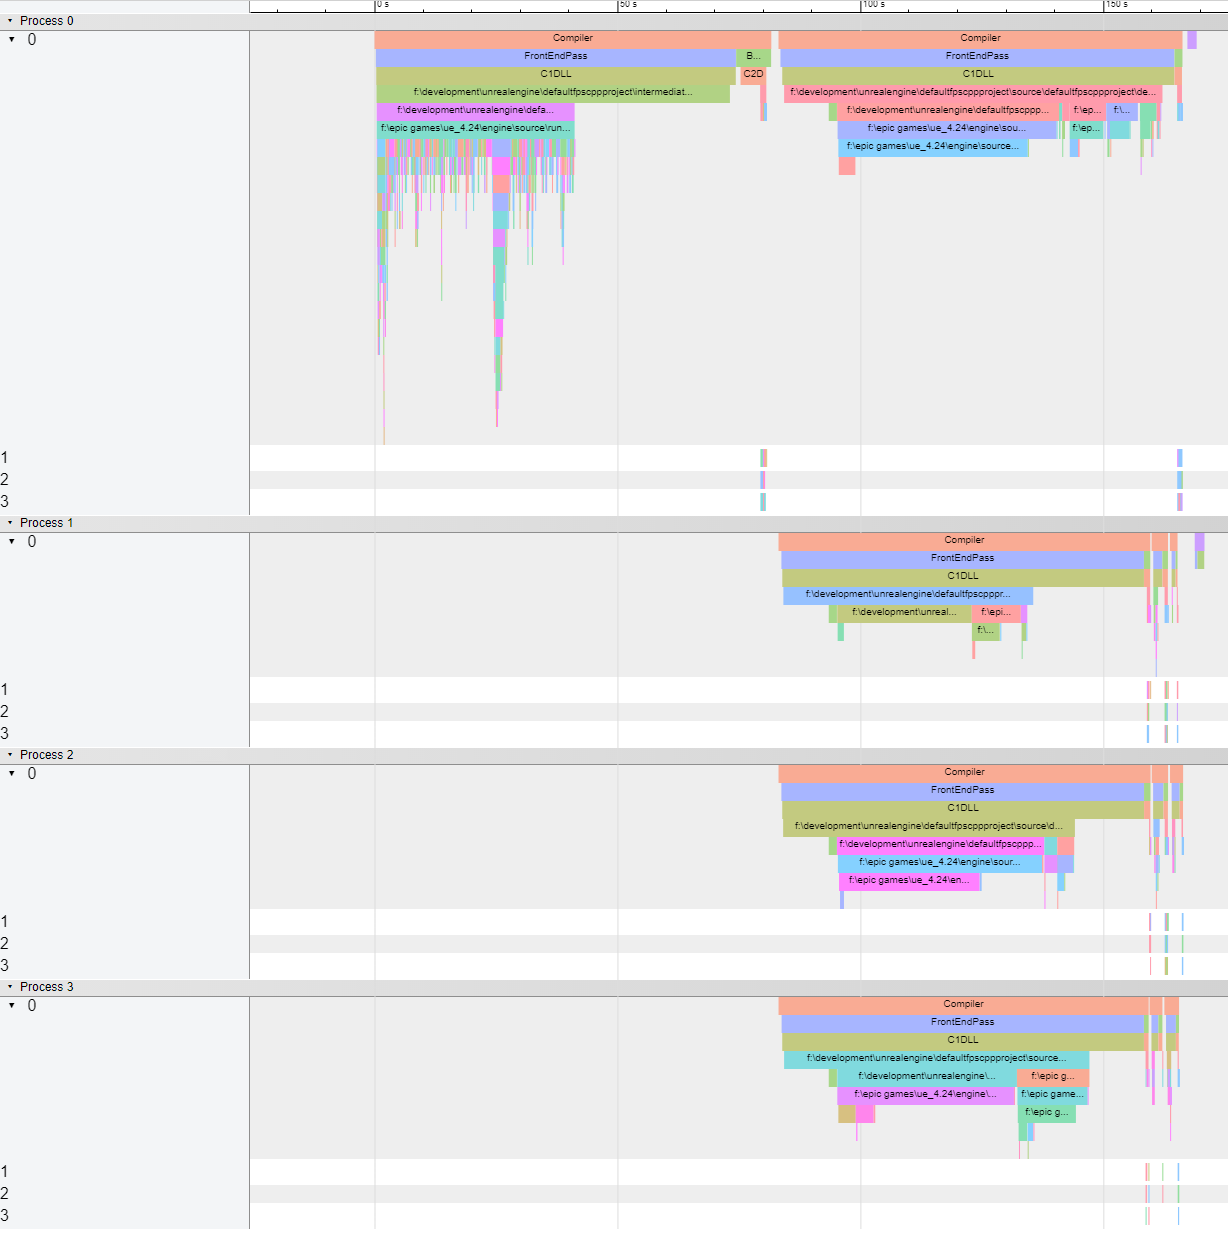
As you can see, ProcessId and ThreadId aren’t the real ones anymore. However, they approach to a more logical distribution of what’s running where! Definitely easier to read for me!
Let’s zoom into DefaultFPSCppProjectGameMode.gen.cpp:

What can we see here? As part of the C1DLL activity we see that this .cpp file includes three other files. We also see that the CodeGeneration activity has all of the functions that get generated (they get generated in parallel, up to 4 because my computer has 4 logical cores).
But we can see something else: the Compiler activity only spans the FrontEndPass and BackEndPass of this file. And, if we go back to the full trace, all Compiler activities only deal with one file. This maps to having a lot of CL MSBuild tasks! Does this mean we aren’t compiling in parallel?
Well, apparently we are compiling in parallel we check the full trace. It looks UnrealHeaderTool is spawning as many cl.exe in parallel as files we want to compile, instead of letting cl.exe do the parallelization itself?
Getting template instantiation data
The last cool thing we’ll see requires using the open source version of vcperf as well as compiling with Visual Studio 16.4 (Visual Studio 2019). This version of vcperf reports some extra events than the one shipping with Visual Studio 2019.
This time, we’ll use @BruceDawson0xB’s project from this blog post, but updated to Visual Studio 2019. Let’s take a look:
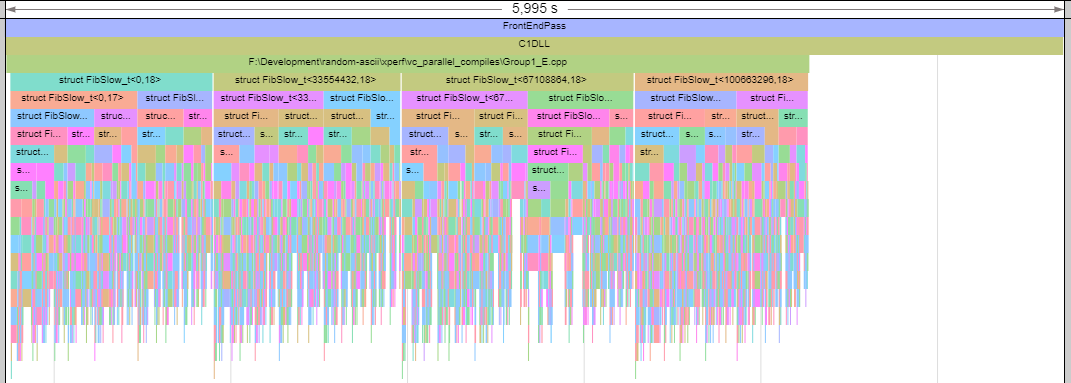
Bruce wanted to make compilations slow and calculated Fibonacci in templates (with some tricks to prevent the compiler from reusing template instantiations). And this is the result!
Of course, these template instantiations can be seen in other projects! This time we’ll build the tool I’ve used for this post in Release|x64 and zoom into Main.cpp:
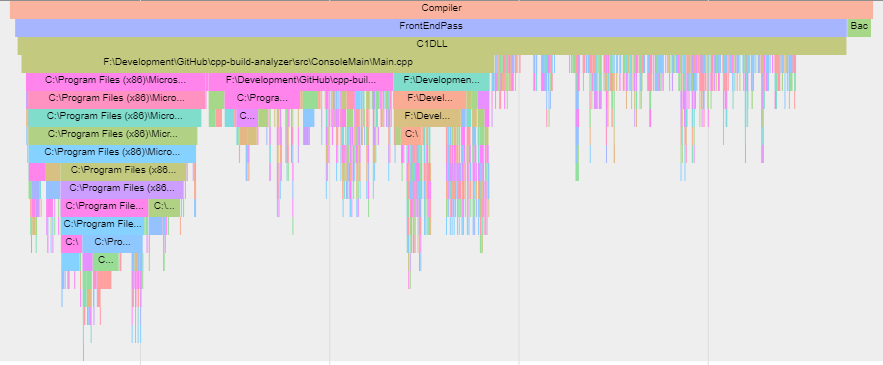
See that huge amount of small entries? Those are template instantiations! And they can be part of any file, so when you include some file you also get which templates get instantiated.
However, have you noticed the small BackEndPass to the right? It’s got no children, hasn’t it? That’s because we’ve built a Release version which has LTCG enabled! Let’s take a look at the Linker activity:

Here’s where the Function activities get compiled! In a previous graph we saw them as part of the BackEndPass activity, but it didn’t have LTCG enabled.
Also, it looks like Visual Studio 2019 also adds Thread activities between CodeGeneration and Function activities!
This exploration of the C++ Build Insights SDK helped me take more informed decisions when investigating C++ compile times and I’m sure I’ll be using it in the future.
Again, let me thank the team that made the SDK possible, and @KevinCadieuxMS in particular!
To write this post I built a tool that’s now available on GitHub for everyone to try!
Thanks for reading!
