Understanding MSBuild to create flame graphs
Investigating C++ compile times
- My journey investigating slow compile times in C++
- Useful tools to investigate C++ compile times
- Understanding MSBuild to create flame graphs
- Improving C++ compile times using flame graphs
- Getting data from C++ Build Insights SDK
I love side projects. You have a problem you want to solve, spend some time thinking about how you’d do it and then start working on a solution that mostly works. When you’ve calmed the itch that started it all, it becomes a product and you start losing interest on it. A new side projects pops in, the cycle repeats.
But this time I managed to finish one!
Over a year ago I started a side project to create a flame graph out of a MSBuild execution. It was inspired by @aras_p’s blog post. Thanks again for everything you’ve written in your blog!
This post serves as a summary of what I learned while developing this tool. I thought it would be a shorter post but then got out of control! We’ll have an extra post fiddling with compiler flags and project configurations to show a lot of examples!
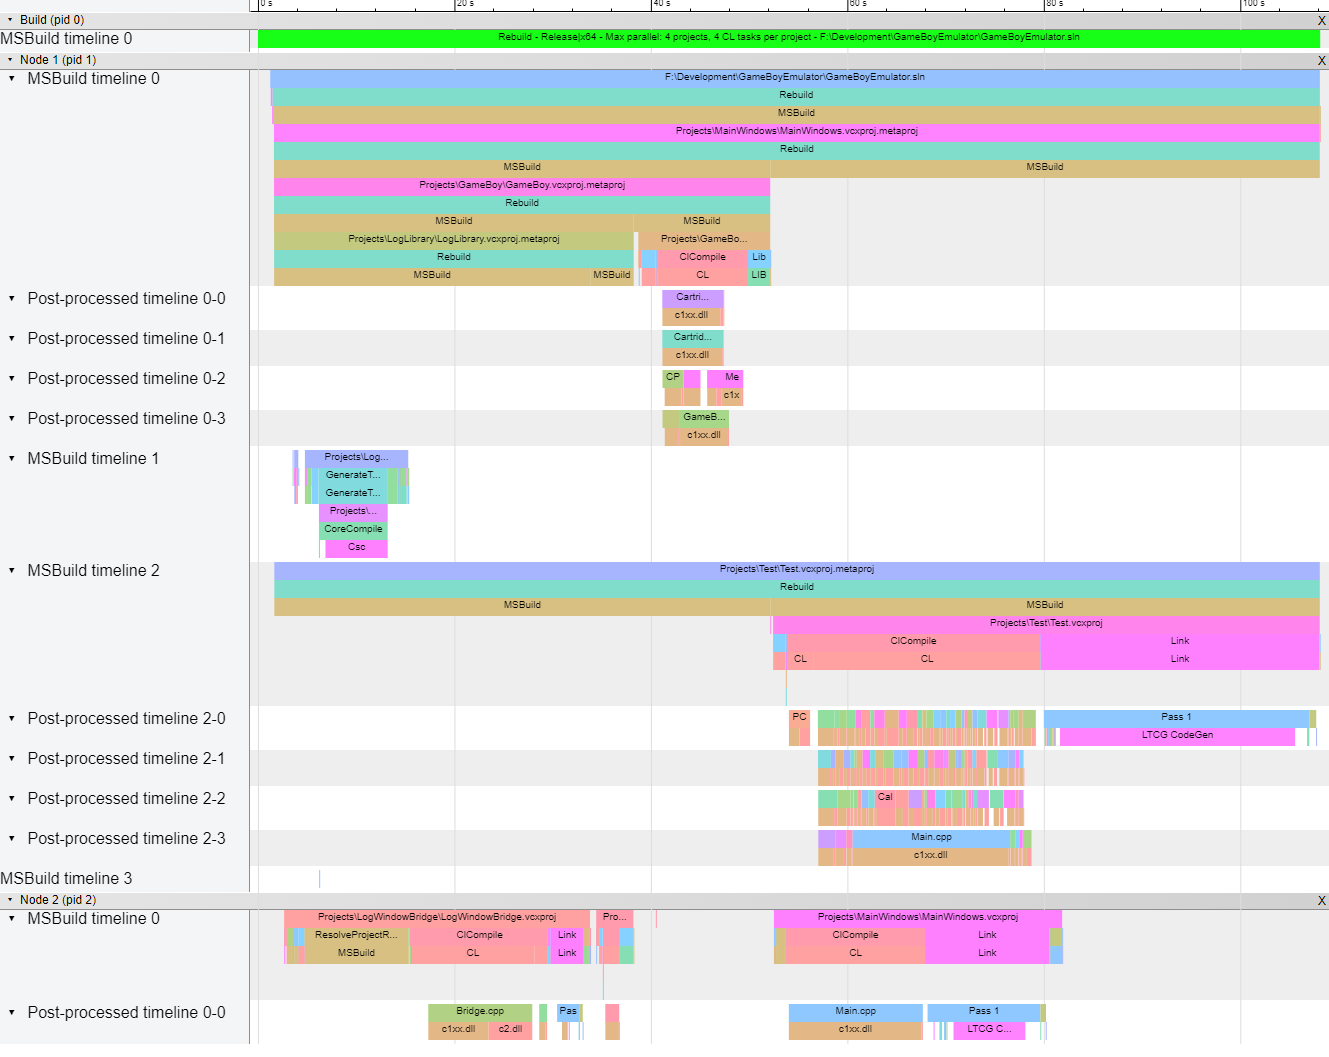
Some of the examples in this post will feature my (unreleased) GameBoy emulator (yeah, one of those abandoned side projects) to illustrate some points. This way, we can see some real data and not just synthetic tests.
The background
When I started looking for ways to investigate build times I ended up with some useful MSVC flags and some Visual Studio options (check previous post in the series for more).
It basically looked like I could compile a solution, parse its output and start working from there. And it didn’t seem very crazy, people build tools around that! Just open Visual Studio’s Developer Command Prompt and type:
devenv.com Z:\path\to\solution.sln /RebuildI’ve used devenv.com instead of devenv.exe because it writes to console.
We’ll get something like:
3>  [...]
4>------ Rebuild All started: Project: GameBoy, Configuration: Debug x64 ------
4>  Cartridge.cpp
4>  [...]
========== Rebuild All: 6 succeeded, 0 failed, 0 skipped ==========
This is basically like building the solution in Visual Studio and copying the Output panel. However, that’s all you have. I guess it isn’t enough for us!
In the previous post I mentioned Visual Studio Extensions use an SDK that lets you hook to MSBuild events and perform your own logic. That means Visual Studio is using MSBuild under the hood, doesn’t it?
Let’s try to build our solution with MSBuild directly (again, within Visual Studio’s Developer Command Prompt):
msbuild.exe Z:\path\to\solution.sln /t:RebuildThis will rebuild our solution and dump a lot of information to console. It looks very much like setting MSBuild project build output verbosity to Normal or Detailed in Visual Studio’s Options window!
We’re getting closer, and MSBuild official documentation has a lot more information on the topic. The key section, for us, will be using MSBuild programmatically.
The goal
Now that we know we can invoke MSBuild ourselves, parsing its output would be complex and still not give us enough data (i.e. no timestamps). Since there’s some kind of API to deal with it programmatically, let’s explore what it can offer!
C# API
At first, when I started building this tool, I was amazed at how little information I could find on how to call MSBuild from C# code. All I found were incomplete or unrelated issues on the MSDN forums, questions without accepted answers at Stack Overflow and a very low number of uses at GitHub.
I spent a lot of time trying to make it work, failing, trying again, mostly working but only for C++ solutions and not C# ones…
In the end, invoking MSBuild just takes these lines:
Dictionary<string, string> globalProperties = new Dictionary<string, string>
{
  { "Configuration", "Debug" },
  { "Platform", "x64" },
};

BuildRequestData data = new BuildRequestData("Z:\\path\\to\\solution.sln",
                                             globalProperties,
                                             null,
                                             new[] { "Rebuild" },
                                             null);

// not providing this default ProjectCollection causes unordered builds
ProjectCollection projectCollection = new ProjectCollection();
BuildParameters parameters = new BuildParameters(projectCollection);
BuildResult result = BuildManager.DefaultBuildManager.Build(parameters, data);
switch(result.OverallResult)
{
  case BuildResultCode.Success:
    // yay!
    break;
  case BuildResultCode.Failure:
    // d'oh!
    break;
}
Simple, right? Well… no.
For it to work you need these BuildRequestData, BuildParameters and BuildManager classes. And this is where the pain started for me.
Reference MSBuild assemblies
By the time I started working on this tool I was using Visual Studio 2015 and I didn’t know where to find any of these assemblies. I only knew they were part of Microsoft.Build packages, as stated in the official docs. So I tried adding a Reference to them via Framework:
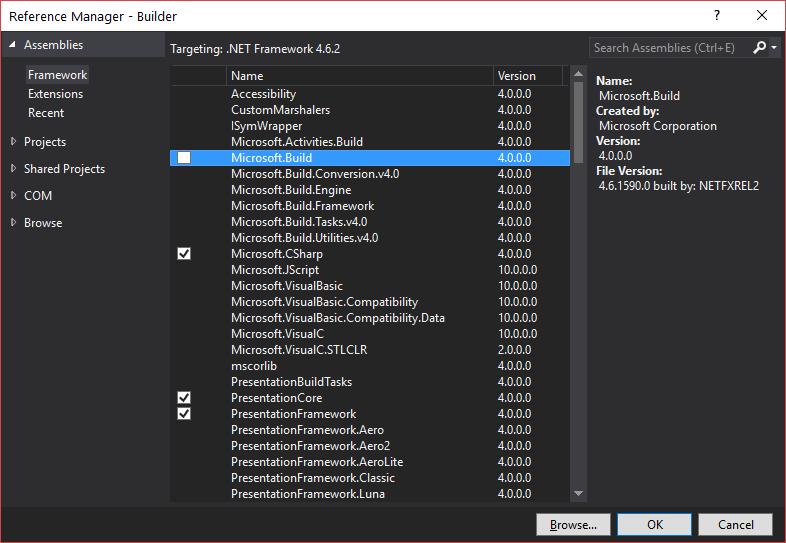
Note it says version 4.0.0.0, I didn’t even know which version I needed! This happened like a year ago so I may have forgotten, but I think it worked for a while until I tried to compile a different kind of project. In any case, I ended up referencing assemblies via the Extensions page:
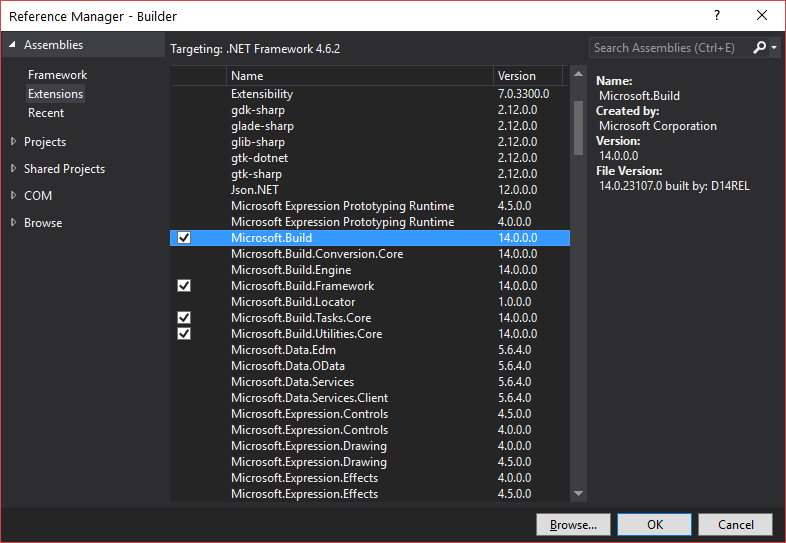
Note it says version 14.0.0.0. Still, no idea why they’re different, but this one worked correctly (and then I knew I was using MSBuild 14).
Bonus: binding redirects
When I thought everything was set, I tried to build my first project and… it failed.
The "Message" task could not be loaded from the assembly Microsoft.Build.Tasks.Core, Version=14.0.0.0, Culture=neutral, PublicKeyToken=b03f5f7f11d50a3a. [...]This cryptic message hit me like a stone. Why can’t it find it? It compiled and I’m executing the tool now!
Oh, well, turns out you have to apply binding redirects to make it build Visual Studio 2015 solutions. More info on the official docs. I’m a C++ programmer and wasn’t aware of this requirement, I guess .NET programmers are used to it!
I ended up adding this kind of entries to my App.config file:
<?xml version="1.0" encoding="utf-8"?>
<configuration>
  <!-- [...] -->
  <runtime>
    <assemblyBinding xmlns="urn:schemas-microsoft-com:asm.v1">
      <dependentAssembly>
        <assemblyIdentity name="Microsoft.Build" culture="neutral" publicKeyToken="b03f5f7f11d50a3a" />
        <bindingRedirect oldVersion="0.0.0.0-99.9.9.9" newVersion="14.0.0.0"/>
      </dependentAssembly>
      <!-- more bindings for Microsoft.Build.Framework and other assemblies! -->
    </assemblyBinding>
  </runtime>
</configuration>
Bonus: MSBuild 15 and WPF projects
Everything seemed to work… until I tried to migrate to MSBuild 15 a year later (so I could build Visual Studio 2017 solutions). There’s an official guide to do so (thank you!).
Apparently, versions under MSBuild 15 were bound to their Visual Studio installation and the new recommended way is to pull them via NuGet packages so they’re separate.
With that in place I was able to build VS2017 C++ projects, but had no luck with C# ones.
My GameBoy emulator is built in C++ but uses a Logger built in WPF. Turns out, WPF uses MSBuild itself to process .xaml files (its UI-definition files). That means it tries to spawn and wait for a new MSBuild process within ours! That results in an Unknown build error: object reference not set to an instance of an object. Yes, a null pointer exception is all of the info you have to diagnose it. Good.
The fix is quite simple, however! Add this property to you WPF project:
<AlwaysCompileMarkupFilesInSeparateDomain>false</AlwaysCompileMarkupFilesInSeparateDomain>And it will use the same MSBuild instance that invoked the build. Voilà!
Get build data
Alright! We’ve managed to make a solution build but we have nothing else to work with! Fear not, the API defines the ILogger interface and the basic Logger class for us! More info on the Build Loggers docs.
Let’s just take everything we can get from the build:
public class AllMessagesLogger : Logger
{
  public override void Initialize(IEventSource eventSource)
  {
    eventSource.AnyEventRaised += OnAnyMessage;
  }

  private void OnAnyMessage(object sender, BuildEventArgs e)
  {
    Console.WriteLine(e.Message);
  }
}
And we can add this logger to the build by modifying the original code with this:
BuildParameters parameters = new BuildParameters()
{
  Loggers = new List<ILogger>() { new AllMessagesLogger() },
};
We’ll now be printing the message associated to every event MSBuild emits. And believe me, there’s a ton of messages!
Still, there are some interesting things we should investigate.
Which events can we hook to?
This is the definition of IEventSource:
public interface IEventSource
{
  event BuildMessageEventHandler MessageRaised;
  event BuildErrorEventHandler ErrorRaised;
  event BuildWarningEventHandler WarningRaised;
  event BuildStartedEventHandler BuildStarted;
  event BuildFinishedEventHandler BuildFinished;
  event ProjectStartedEventHandler ProjectStarted;
  event ProjectFinishedEventHandler ProjectFinished;
  event TargetStartedEventHandler TargetStarted;
  event TargetFinishedEventHandler TargetFinished;
  event TaskStartedEventHandler TaskStarted;
  event TaskFinishedEventHandler TaskFinished;
  event CustomBuildEventHandler CustomEventRaised;
  event BuildStatusEventHandler StatusEventRaised;
  event AnyEventHandler AnyEventRaised;
}
Nice, our old friends the Project, Target and Task! We’ll come back to them in a bit and explore their relationships.
For now, just remember you can bind to different kind of events to get only what you’re interested in.
BuildEventArgs
This is the base class for these events. Of all members it’s got we’re interested in these ones:
Timestamp: theDateTimewhen the event was emitted (the when).Message: the text you’ve already read within Visual Studio’s Output panel (the what).BuildEventContext: the context this event lives in (the where).
Let’s try to understand what’s the BuildEventContext then!
BuildEventContext
This class looks like this:
public class BuildEventContext
{
  public int ProjectContextId { get; }
  public int NodeId { get; }
  public int ProjectInstanceId { get; }
  public int TaskId { get; }
  public int TargetId { get; }

  public long BuildRequestId { get; }
  public int SubmissionId { get; }
  public int EvaluationId { get; }
}
We’re only interested in the first members:
ProjectContextIdidentifies this context, useful when comparing two of them.NodeId, after a bit of testing, identifies the logical timeline where it got executed (starts at 1). It has nothing to do with processors, cores or threads so it can get pretty high.ProjectContextId,TargetIdandTaskIdidentify where this event got executed within a hierarchy. We’ll come back to them shortly.
Alright, I think we can’t postpone exploring Project, Target and Task anymore!
Projects, targets and tasks
MSBuild data is defined in XML files and there’s a hierarchy between definitions. These are the basics:
Project
You may not know it, but that .vcxproj project file you’ve got is an XML file with MSBuild definitions. A Visual Studio 2015 project, for example, looks like:
<?xml version="1.0" encoding="utf-8"?>
<Project DefaultTargets="Build" ToolsVersion="14.0" xmlns="[...]">
  <ItemGroup Label="ProjectConfigurations">
    <ProjectConfiguration Include="Debug|x64">
      <Configuration>Debug</Configuration>
      <Platform>x64</Platform>
    </ProjectConfiguration>
    <!-- [...] -->
  </ItemGroup>
  <!-- [...] -->
</Project>
The key tag is Project, the root of the document. You can head to the official documentation for more info, but let’s just keep Project in cache.
Target
If we continue exploring this .vcxproj file we’ll find this section:
<!-- [...] -->
<ItemDefinitionGroup Condition="'$(Configuration)|$(Platform)'=='Debug|x64'">
  <ClCompile>
    <WarningLevel>Level3</WarningLevel>
    <Optimization>Disabled</Optimization>
    <PreprocessorDefinitions>_DEBUG;_LIB;%(PreprocessorDefinitions)</PreprocessorDefinitions>
    <SDLCheck>true</SDLCheck>
    <MinimalRebuild>true</MinimalRebuild>
  </ClCompile>
  <Link>
    <SubSystem>Windows</SubSystem>
    <GenerateDebugInformation>true</GenerateDebugInformation>
  </Link>
</ItemDefinitionGroup>
<!-- [...] -->
There are two tags I want you to pay attention to: ClCompile and Link. Both are specialized Target definitions (we’ll see how in a moment). A Target lives within a Project and groups Task definitions together in a given order. You can read more in the official documentation.
Task
Finally, tasks execute the real logic behind all these definitions. They can create directories (MakeDir task), compile code (CL task) or invoke other projects (MSBuild task), for example.
We could faithfully believe they’re part of a Target, but let’s have a look ourselves, shall we? If you have a basic .vcxproj you won’t see any Task, but you’ll get this entry:
<Import Project="$(VCTargetsPath)\Microsoft.Cpp.targets" />If you were to find that file, you’d see it has some definitions that point to Microsoft.Cpp.Current.targets and you could continue down the rabbit hole until you get to Microsoft.CppCommon.targets. Inside that file you can find the definition of the ClCompile target:
<!-- [...] -->
<Target Name="ClCompile"
        Condition="'@(ClCompile)' != ''"
        DependsOnTargets="SelectClCompile">
  <CL Condition="[...]" />
  <CL Condition="[...]" />
  <!-- [...] -->
</Target>
<!-- [...] -->
And that’s where the CL task gets invoked!
Nice, so a Project can have Target entries and a Target groups Task entries together (one of which can spawn other Project).
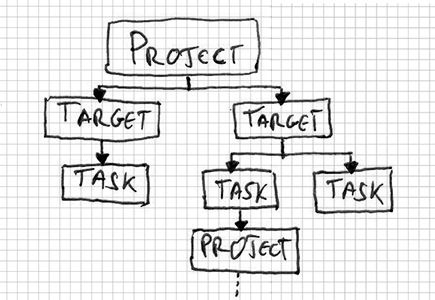
This is all great, but what’s a Solution file then?
Solution
If we were to open a Visual Studio 2015 .sln file we’d find some structured text:
Microsoft Visual Studio Solution File, Format Version 12.00
# Visual Studio 14
VisualStudioVersion = 14.0.23107.0
MinimumVisualStudioVersion = 10.0.40219.1
[...]
Project("{8BC9CEB8-8B4A-11D0-8D11-00A0C91BC942}") = "GameBoy", "Projects\GameBoy\GameBoy.vcxproj", "{A9A3EC03-A464-4D7C-AC36-857D50CCA937}"
  ProjectSection(ProjectDependencies) = postProject
    {E6C50B23-8563-4980-B0E4-DD4B0570810D} = {E6C50B23-8563-4980-B0E4-DD4B0570810D}
  EndProjectSection
EndProject
[...]
Global
  GlobalSection(SolutionConfigurationPlatforms) = preSolution
    Debug|x64 = Debug|x64
  EndGlobalSection
  [...]
EndGlobal
This defines which projects exist within our solution, their relationship and some other data. If we go back to our Visual Studio’s Developer Command Prompt and type:
set MSBuildEmitSolution=1
msbuild.exe Z:\path\to\solution.sln
We’ll get several .metaproj files we can open. And surprise, they are MSBuild compilant files!
<?xml version="1.0" encoding="utf-8"?>
<Project ToolsVersion="14.0"
         xmlns="http://schemas.microsoft.com/developer/msbuild/2003"
         InitialTargets="ValidateSolutionConfiguration;ValidateToolsVersions;ValidateProjects"
         DefaultTargets="Build">
  <!-- [...] -->
  <Target Name="GameBoy:Rebuild" ... />
  <!-- [...] -->
</Project>
See the name of the generated Target? This is why we can Rebuild a project (and not the full solution) by executing:
msbuild.exe Z:\path\to\solution.sln /t:ProjectName:RebuildGreat, so now that we know how MSBuild is structured, we can continue. But before we move on, this is the key takeaway from this section:
Don’t be afraid of diving as deep as you can when facing a new system.
Tying it all together
Let’s take the AllMessagesLogger we created before and run a build. Simplifying a whole lot and gracefully indenting it, we’d get something like:
BuildStarted
  ProjectStarted
    TargetStarted
      TaskStarted
      TaskFinished
      TaskStarted
        ProjectStarted
          [...]
        ProjectFinished
      TaskFinished
    TargetFinished
    TargetStarted
      [...]
    TargetFinished
  ProjectFinished
BuildFinished
Doesn’t this looks like a hierarchy to you?
Build
  Project
    Target
      Task
      Task
        Project
          [...]
    Target
We can now start building our timeline!
Issues
At first, I thought it would be enough to keep stacking events together but soon enough I found not every entry refers to the same hierarchy. You may have two Project building in parallel and events get mixed up.
Here’s where we go back to the BuildEventContext. Remember it had ProjectInstanceId, TargetId and TaskId members? Thanks to that, we can recreate the actual hierarchy!
Each context will populate these values as we get deeper in the hierarchy (i.e. a Project won’t have a TargetId defined), with some exceptions:
- The
Buildis a unique element with no context. - A
Projecthas aParentEventContextmember (defined in theProjectStartedEventclass). It can be empty (it’s a top-levelProject) or reference aTaskcontext.
There are a lot of caveats in the implementation, some inconsistencies (like a Task that spawns a Project but that Task is finished before the Project even starts), and some trial and error.
But, eventually, you get to something!
Google Chrome’s trace viewer
Now that we’ve got our hierarchy in memory we should dump it to some kind of file. Turns out, Google Chrome has this chrome://tracing viewer we can use!
We’ll create a JSON file with a couple of special properties that let us visualize flame graphs. The format and properties are available in this doc.
{
  "traceEvents": [
    { "ph": "B", "pid": 0, "tid": 0, "ts": 0.0, "name": "Hello, flame graph!" },
      { "ph": "B", "pid": 0, "tid": 0, "ts": 2000.0, "name": "I'm a child!" },
      { "ph": "E", "pid": 0, "tid": 0, "ts": 8000.0 },
    { "ph": "E", "pid": 0, "tid": 0, "ts": 10000.0 }
  ]
}
I’ve indented each object to give you a sense of hierarchy, but they’re all children of traceEvents. You can load it into the viewer and this will be the result:

Flame graphs
Let’s take everything, build a couple of projects and see it in action!
Blank project
If you create a blank C++ Win32 Console Application in Visual Studio 2015 with the default configuration, this is how it looks like:

See how it has two CL tasks? One is the pre-compiled header and the other one is the main file. We’ll see why they’re separate in the next post.
GameBoy emulator
This is the trace from my GameBoy emulator (we’ll try to improve it in the next post):
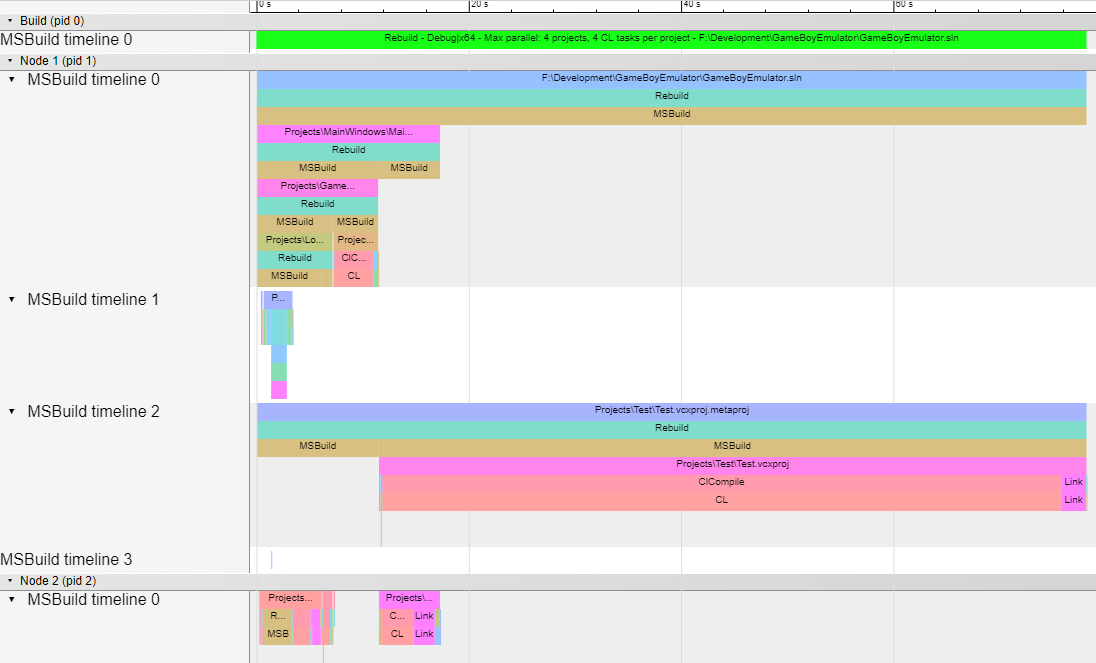
See how it’s using several NodeId and each one has a number of timelines? They represent projects with dependencies!
The top-level Solution executes a MSBuild task to build MainWindows.vcxproj.metaproj (within the same NodeId) and Test.vcxproj.metaproj (in a separate NodeId). Both wait for GameBoy.vcxproj.metaproj to finish (although it’s unreadable in the graph), which in turn waits for another project to build…
It’s a bit complex because of the (seemingly) arbitrary NodeId switches, but that’s how MSBuild schedules project builds!
Remember, these .vcxproj.metaproj are generated from the .sln file!
We can force the execution to build only one project in parallel, and this is the result:
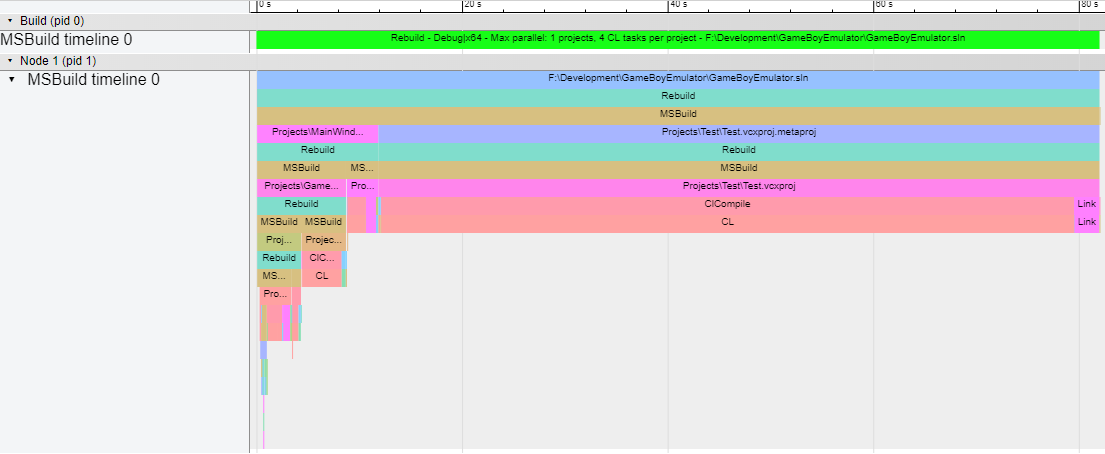
Now, dependencies are much more apparent!
Bruce Dawson’s parallel build
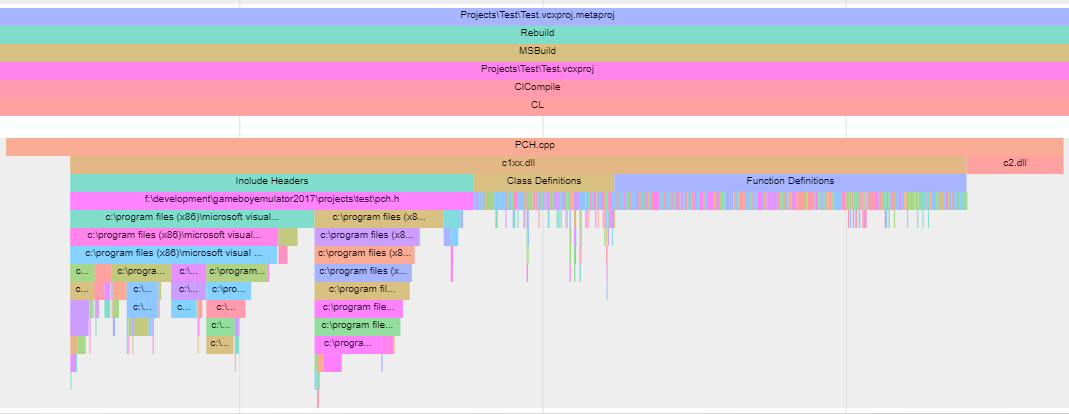
Finally, while investigating slow compile times I read this blog post by @BruceDawson0xB and it helped me a lot (thank you!). He provides the project he used for the post, so I downloaded it and this is its graph:

If you want to know why there are that many CL tasks, I invite you to check his blog post or wait for the next entry in the series!
That’s all for now! We’ve seen how to invoke MSBuild from C# and use its Logger to create our flame graphs.
In the next post we’ll try to understand these graphs, try to diagnose possible issues, and fiddle with some MSVC flags to get extra information (I’m looking at you /Bt+ and /d1reportTime!).
Thanks for reading!
Investigating C++ compile times
- My journey investigating slow compile times in C++
- Useful tools to investigate C++ compile times
- Understanding MSBuild to create flame graphs
- Improving C++ compile times using flame graphs
- Getting data from C++ Build Insights SDK

