Useful tools to investigate C++ compile times
Investigating C++ compile times
- My journey investigating slow compile times in C++
- Useful tools to investigate C++ compile times
- Understanding MSBuild to create flame graphs
- Improving C++ compile times using flame graphs
- Getting data from C++ Build Insights SDK
People build the projects they work on several times a day. More often than not, we perform the minimal build cycle: modify some code in a single file, save it and build. Other, sometimes painful, times we have to go through the full build cycle: rebuilding the whole project.
These cycles take some time and what happens under the hood is totally dependent on your development environment and project.
It took me a while to start worrying about these cycles and whether they were long or not. You know why it started? With rising anxiety and a feeling that I wasn’t as productive.
These slow build times come with some costs:
- People aren’t happy to stare at progress bar, so they may as well procrastinate and lose focus.
- The time they waste waiting is time they aren’t improving your product, either adding new features or iterating.
So, a while ago I set myself on a journey to identify what was causing them. And just so we are on the same page: my main development environment was Visual Studio 2015 running on Windows, building C++ projects with MSVC.
This was (more or less!) the process to answer: how long does it take to build?
Disclaimer: I’ll be illustrating the process with my (unreleased) GameBoy emulator side-project. It’s a small project (we won’t see huge numbers) but it’s not a synthetic test (it mainly consists of C++ but uses C# and C++/CLI for a log window). This post will only cover how to get some build times, we’ll see examples of how to improve them in a later entry in the series.
Visual Studio options
Okay, so we build our project and have just an intuition of how long it takes. But we need some numbers! Just the big picture, nothing too detailed. All I had was Visual Studio’s output panel, and it just said:
1>------ Rebuild All started: Project: LogWindowUI, Configuration: Debug x64 ------
1>  [...]
2>------ Rebuild All started: Project: LogWindowBridge, Configuration: Debug x64 ------
2>  [...]
3>------ Rebuild All started: Project: LogLibrary, Configuration: Debug x64 ------
3>  [...]
4>------ Rebuild All started: Project: GameBoy, Configuration: Debug x64 ------
4>  [...]
5>------ Rebuild All started: Project: MainWindows, Configuration: Debug x64 ------
5>  [...]
6>------ Rebuild All started: Project: Test, Configuration: Debug x64 ------
6>  [...]
========== Rebuild All: 6 succeeded, 0 failed, 0 skipped ==========
I could take a stopwatch and start it as soon as I hit the build button, but not much more.
After checking Visual Studio’s documentation and Stack Overflow questions on this matter, I ended up on this Microsoft Docs site.
Let’s explore some options.
Build and Run
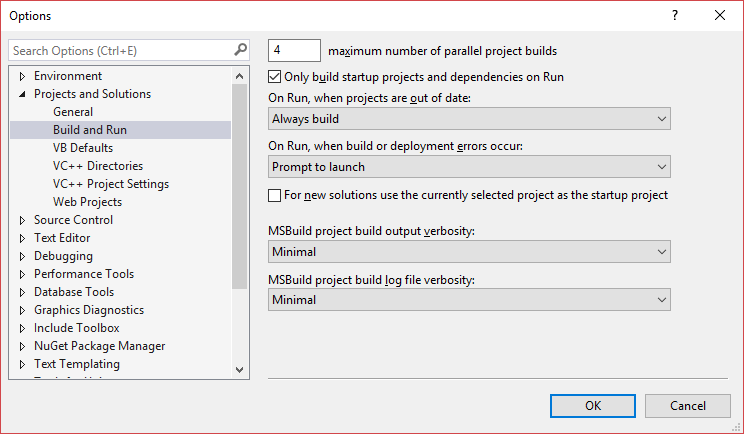
This page has several useful options, and we’ll come back to it later on, but let’s just take a look at MSBuild project build output verbosity.
If we increase it from Minimal to Normal, we get this output:
1>------ Rebuild All started: Project: LogWindowUI, Configuration: Debug x64 ------
1>Build started DD/MM/YYYY HH:MM:SS.
1>  [...]
1>Build succeeded.
1>
1>Time Elapsed 00:00:02.47
[...]
6>------ Rebuild All started: Project: Test, Configuration: Debug x64 ------
6>Build started DD/MM/YYYY HH:MM:SS.
6>  [...]
6>ClCompile:
6>  Main.cpp
6>  [...]
6>Link:
6>  [...]
6>Build succeeded.
6>
6>Time Elapsed 00:01:36.92
========== Rebuild All: 6 succeeded, 0 failed, 0 skipped ==========
Great! We now have some data to work with! There are three interesting additions:
Build started DD/MM/YYYY HH:MM:SS: the real output doesn’t show those letters, but actual numbers. We now know when this project started building.Time Elapsed HH:MM:SS.ms: we now know how long it took to build this project.ClCompile,Linkand other new sections: they are what MSBuild calls targets. We’ll come back to them in depth later on.
If we increase the previous option from Normal to Detailed the output will be more verbose, it will include more info on those targets and also add tasks to the log. All this data will prove extremely useful in the future, but they don’t add extra information on how long it takes to build. Even worse: the build itself gets slower as you increase this log level.
VC++ Project Settings
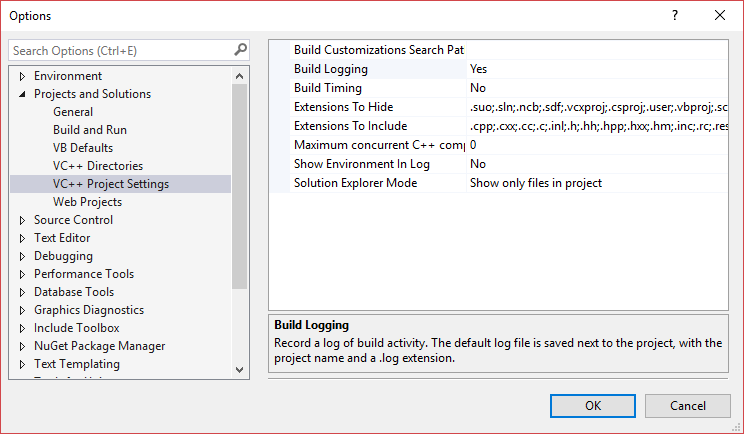
This page also has a handful of useful options, but the most important one for us is Build Timing.
When we enable it and build our project, we get something like this:
[...]
6>------ Rebuild All started: Project: Test, Configuration: Debug x64 ------
6>Build started 25/03/2020 11:03:11.
6>  [...]
6>Project Performance Summary:
6>    96955 ms  F:\Development\GameBoyEmulator\Projects\Test\Test.vcxproj   1 calls
6>              96955 ms  Rebuild                                    1 calls
6>
6>Target Performance Summary:
6>        0 ms  AfterRebuild                               1 calls
6>       [...]
6>       41 ms  WarnCompileDuplicatedFilename              1 calls
6>      182 ms  CoreCppClean                               1 calls
6>      489 ms  SetCABuildNativeEnvironmentVariables       1 calls
6>     2332 ms  Link                                       1 calls
6>    93807 ms  ClCompile                                  1 calls
6>
6>Build succeeded.
6>
6>Time Elapsed 00:01:36.92
========== Rebuild All: 6 succeeded, 0 failed, 0 skipped ==========
Now we’re talking! This output includes the time spent on each target as reported by MSBuild (we still don’t know what’s a target!), so we know where it’s getting slow. Are C++ file compilations slow? Or maybe link times are too high?
By the way, this option and the one from the previous point aren’t related to each other: you can leave the former as Minimal and enable the latter.
So far, so good! What should we do with this, then? Should we try to parse this output and build a timeline already? Let’s continue looking for tools first.
Visual Studio extensions
A lot of the times you want some tool, chances are someone already built it. And, in this Visual Studio ecosystem we’re bound to, we should take a look at Extensions.
Let me discuss a couple of the ones I found more suitable for my needs.
Build Monitor
Build Monitor is an interesting extension that supports, at the time of writing, up to Visual Studio 2015.
Turns out, Visual Studio Extensions’ SDK lets you get notified of some MSBuild key events: when did the build start? when did a project finish? And that’s what this extension does. Build your solution and you’ll get this kind of output:
Solution loaded:    GameBoyEmulator
------------------------------------------------------------
 - 00h 00m 05s 298ms  -- LogWindowUI --
 - 00h 00m 03s 594ms  -- LogWindowBridge --
 - 00h 00m 01s 555ms  -- LogLibrary --
 - 00h 00m 06s 393ms  -- GameBoy --
 - 00h 00m 04s 852ms  -- MainWindows --
 - 00h 01m 38s 037ms  -- Test --
[1] Time Elapsed: 00h 01m 55s 300ms     Session build time: 00h 01m 55s 300ms
While Visual Studio is open, it will keep track of the session, adding up each compilation you do. What if you close Visual Studio? The session is gone, but the coolest thing is that sessions are persisted to a JSON file! This way, you can always come back to them.
This is good enough to compare two builds together!
Tool idea
Have all programmers (or everyone using Visual Studio!) in your team install this extension. Build a script that collects each JSON file at the end of the day, sends it to a server and clears the local one. Later on, aggregate all files together, tag data as necessary and you have the time your team is wasting by building the project (including how often each project is built)! If you plot it, you can even see some trends over time or spikes when a big code change happens.
This is the real time people waste, not how long your build server takes to make a build.
Be careful, tho! The results may be daunting at first (i.e. too much time wasted)!
Parallel Builds Monitor
If you liked the previous one but prefer a more graphical approach, then take a look at Paralel Builds Monitor. It’s got better version support, up to Visual Studio 2019 (at the time of writing).

Although this extension can also export build data to a CSV file, it’s the Gantt chart that I like the most. Not only it tells you which projects are building in parallel (you may think you removed some dependency but didn’t!), it lets you quickly see how long did each project take to build. Absolutely recommended!
This graph can be docked like another panel, so be careful if you’re an anxious person: seeing how much time is gone on each build may be unwise for you!
MSVC compiler flags
Nice, so we’ve got some big numbers and we know which projects take longer to build. But we still don’t know where time is spent! Fortunately, MSVC has some compiler options that can help us investigate further:
/Bt+
This flag applies to the compiler and produces this sample output when turned on:
1>  File.cpp
1>  time(Z:\path\to\compiler\c1xx.dll)=0.39427s < 1617765075910 - 1617766036302 > BB [Z:\path\to\File.cpp]
1>  time(Z:\path\to\compiler\c2.dll)=0.06475s < 1617766053824 - 1617766211553 > BB [Z:\path\to\File.cpp]
This shows the time spent on the front-end (c1xx.dll as we’re compiling C++ code, it would be c1.dll when compiling C code) and on the back-end (c2.dll). It’s extremely useful to narrow the long times down.
You can find more info on the official C++ devblogs.
/time+
This one applies to the linker and gives this kind of output in a typical Debug build:
5>  Linker: Pass 1: Interval #1, time = 0.78976s [Z:\path\to\program.exe]
5>  Linker:   Wait PDB close Total time = 0.32035s PB: 7331840 [Z:\path\to\program.exe]
5>  Linker: Pass 2: Interval #2, time = 0.48362s [Z:\path\to\program.exe]
5>  Linker: Final Total time = 1.27344s < 1618429762951 - 1618432864884 > PB: 7331840 [Z:\path\to\program.exe]
While you’ll get this info in a typical Release build:
5>  Linker: (Z:\path\to\compiler\c2.dll)   LTCG Load Main.obj: Total time = 0.04933s PB: 35180544 [Z:\path\to\program.exe]
5>  [...]
5>  Linker: (Z:\path\to\compiler\c2.dll)   OptRef Total time = 0.00091s PB: 40161280 [Z:\path\to\program.exe]
5>  Generating code
5>  [...]
5>  Finished generating code
5>  Linker: (Z:\path\to\compiler\c2.dll)   LTCG CodeGen Total time = 2.58961s PB: 57692160 [Z:\path\to\program.exe]
5>  Linker: (Z:\path\to\compiler\c2.dll)   OptRef Total time = 0.00077s PB: 60547072 [Z:\path\to\program.exe]
5>  Linker: (Z:\path\to\compiler\c2.dll)   OptIcf Total time = 0.00857s PB: 60551168 [Z:\path\to\program.exe]
5>  Linker: (Z:\path\to\compiler\c2.dll) Pass 1: Interval #1, time = 3.56095s [Z:\path\to\program.exe]
5>  Linker: (Z:\path\to\compiler\c2.dll)   Wait PDB close Total time = 0.14563s PB: 59539456 [Z:\path\to\program.exe]
5>  Linker: (Z:\path\to\compiler\c2.dll) Pass 2: Interval #2, time = 0.23024s [Z:\path\to\program.exe]
5>  Linker: (Z:\path\to\compiler\c2.dll) Final Total time = 3.79130s < 1618638531573 - 1618647766698 > PB: 59539456 [Z:\path\to\program.exe]
Remember: by default Release configurations have Link Time Code Generation turned on to optimize further!
You can also find more info here.
/verbose
Although this flag doesn’t give you elapsed times, it’s also very useful if you want to investigate why link times are slow. I haven’t had much luck with it, but it’s interesting to see the amount of data the linker processes.
/d2cgsummary
This flag enables a cool behavior on the compiler’s back-end (hence the d2) from Visual Studio 2015 onwards. I learned about this flag thanks to Aras, and I invite you to check his blog post for the full explanation!
The key takeaway is that you get a summary of the code generation which includes anomalistic compile times and points you to the functions you should investigate!
Although the slow build times I have investigated weren’t related to code generation, this flag is extremely useful!
/d1reportTime
Again, I learned about this flag thanks to Aras, so please check his post for all of the info. This one applies to the compiler’s front-end (hence the d1).
The bad thing about this flag is the huge amount of data it gives… and the cool thing is the huge amount of data it gives! You get, separately, the time spent when including files (hierarchically!), the one declaring classes and the same for functions. It also has a summary on each section with the top sorted culprits so you can find useful data more easily.
If only we could visualize its output in a more graphical way…
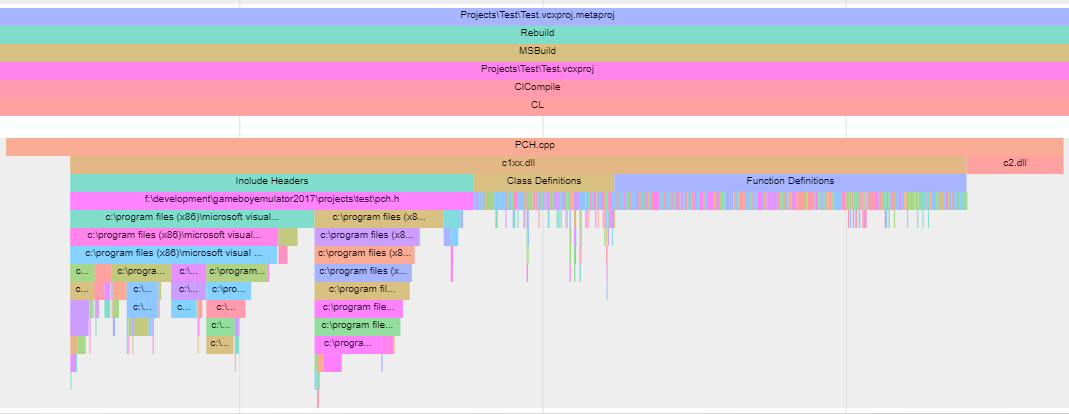
This is a teaser of the next post in the series!
It’s a pity this flag is only available on Visual Studio 2017 onwards, because at the time I started investigating build times we were bound to VS2015.
External tools
Now that we know how to get high level and low level build times, we should check some other tools to complement this data or help us diagnose why they’re happening.
So far we’ve been talking about C++ development, and that means talking about #include clauses. We’ve also mentioned MSVC compiler execution consists of two phases:
- Front-end: reads code files, parses them, executes preprocessor directives (i.e.
#includeclauses) and applies semantic analysis. - Back-end: takes front-end’s output and performs code generation.
When you have large files and a lot of dependencies via #include, you’re bound to have long front-end execution times. When that’s the case, it’s useful to see those connections.
doxygen
Yes, the one that helps you document your code. doxygen comes with a handful of tools, and one of them is building dot graphs.
This example is extracted from doxygen’s docs, but trust me when I tell you it can handle huge dependency graphs:
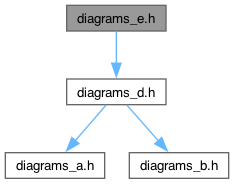
The cool thing about these graphs is they’re interactive when you use the html version (check previous link) and you can navigate at will. There’s even an option to configure the maximum inclusion depth in a single graph, so it has you covered!
Header Hero
A long while ago I found this blog post (which also gives very useful techniques to reduce your file dependencies!) and had a try. But it wasn’t until I read @aras_p in this other blog post that I put it to good use.
This tool has proven very useful, although it can take some trial and error to get the data you’re looking for when your project is very complex. I highly recommend you check Aras’ additions to the tool as well!
When you get it working, take one of the biggest contributors or hubs, click on it and start exploring which files include it. Should they? Can you refactor your code so they don’t (i.e. forward declarations, remove nested classes or enums)?
Visual Studio Code Map
Unfortunately this tool is only available in a Visual Studio Enterprise installation, so I haven’t tested it myself (although it looks promising!).
From what I see in the official documentation it produces complex graphs with several layers of data, but I guess some of that complexity may be configurable.
The great thing about finding this tool was learning there’s a graph format you can use for your own tools, and Visual Studio will be the viewer! You may use it for #include clauses, asset dependencies or whatever fits in a directed graph!
Other tools with dependency graphs
I also found some other Visual Studio extensions that give you inclusion dependency graphs like Include Toolbox (VS2017+) or Visual Assist (has a trial version).
I’m sure there are a lot more!
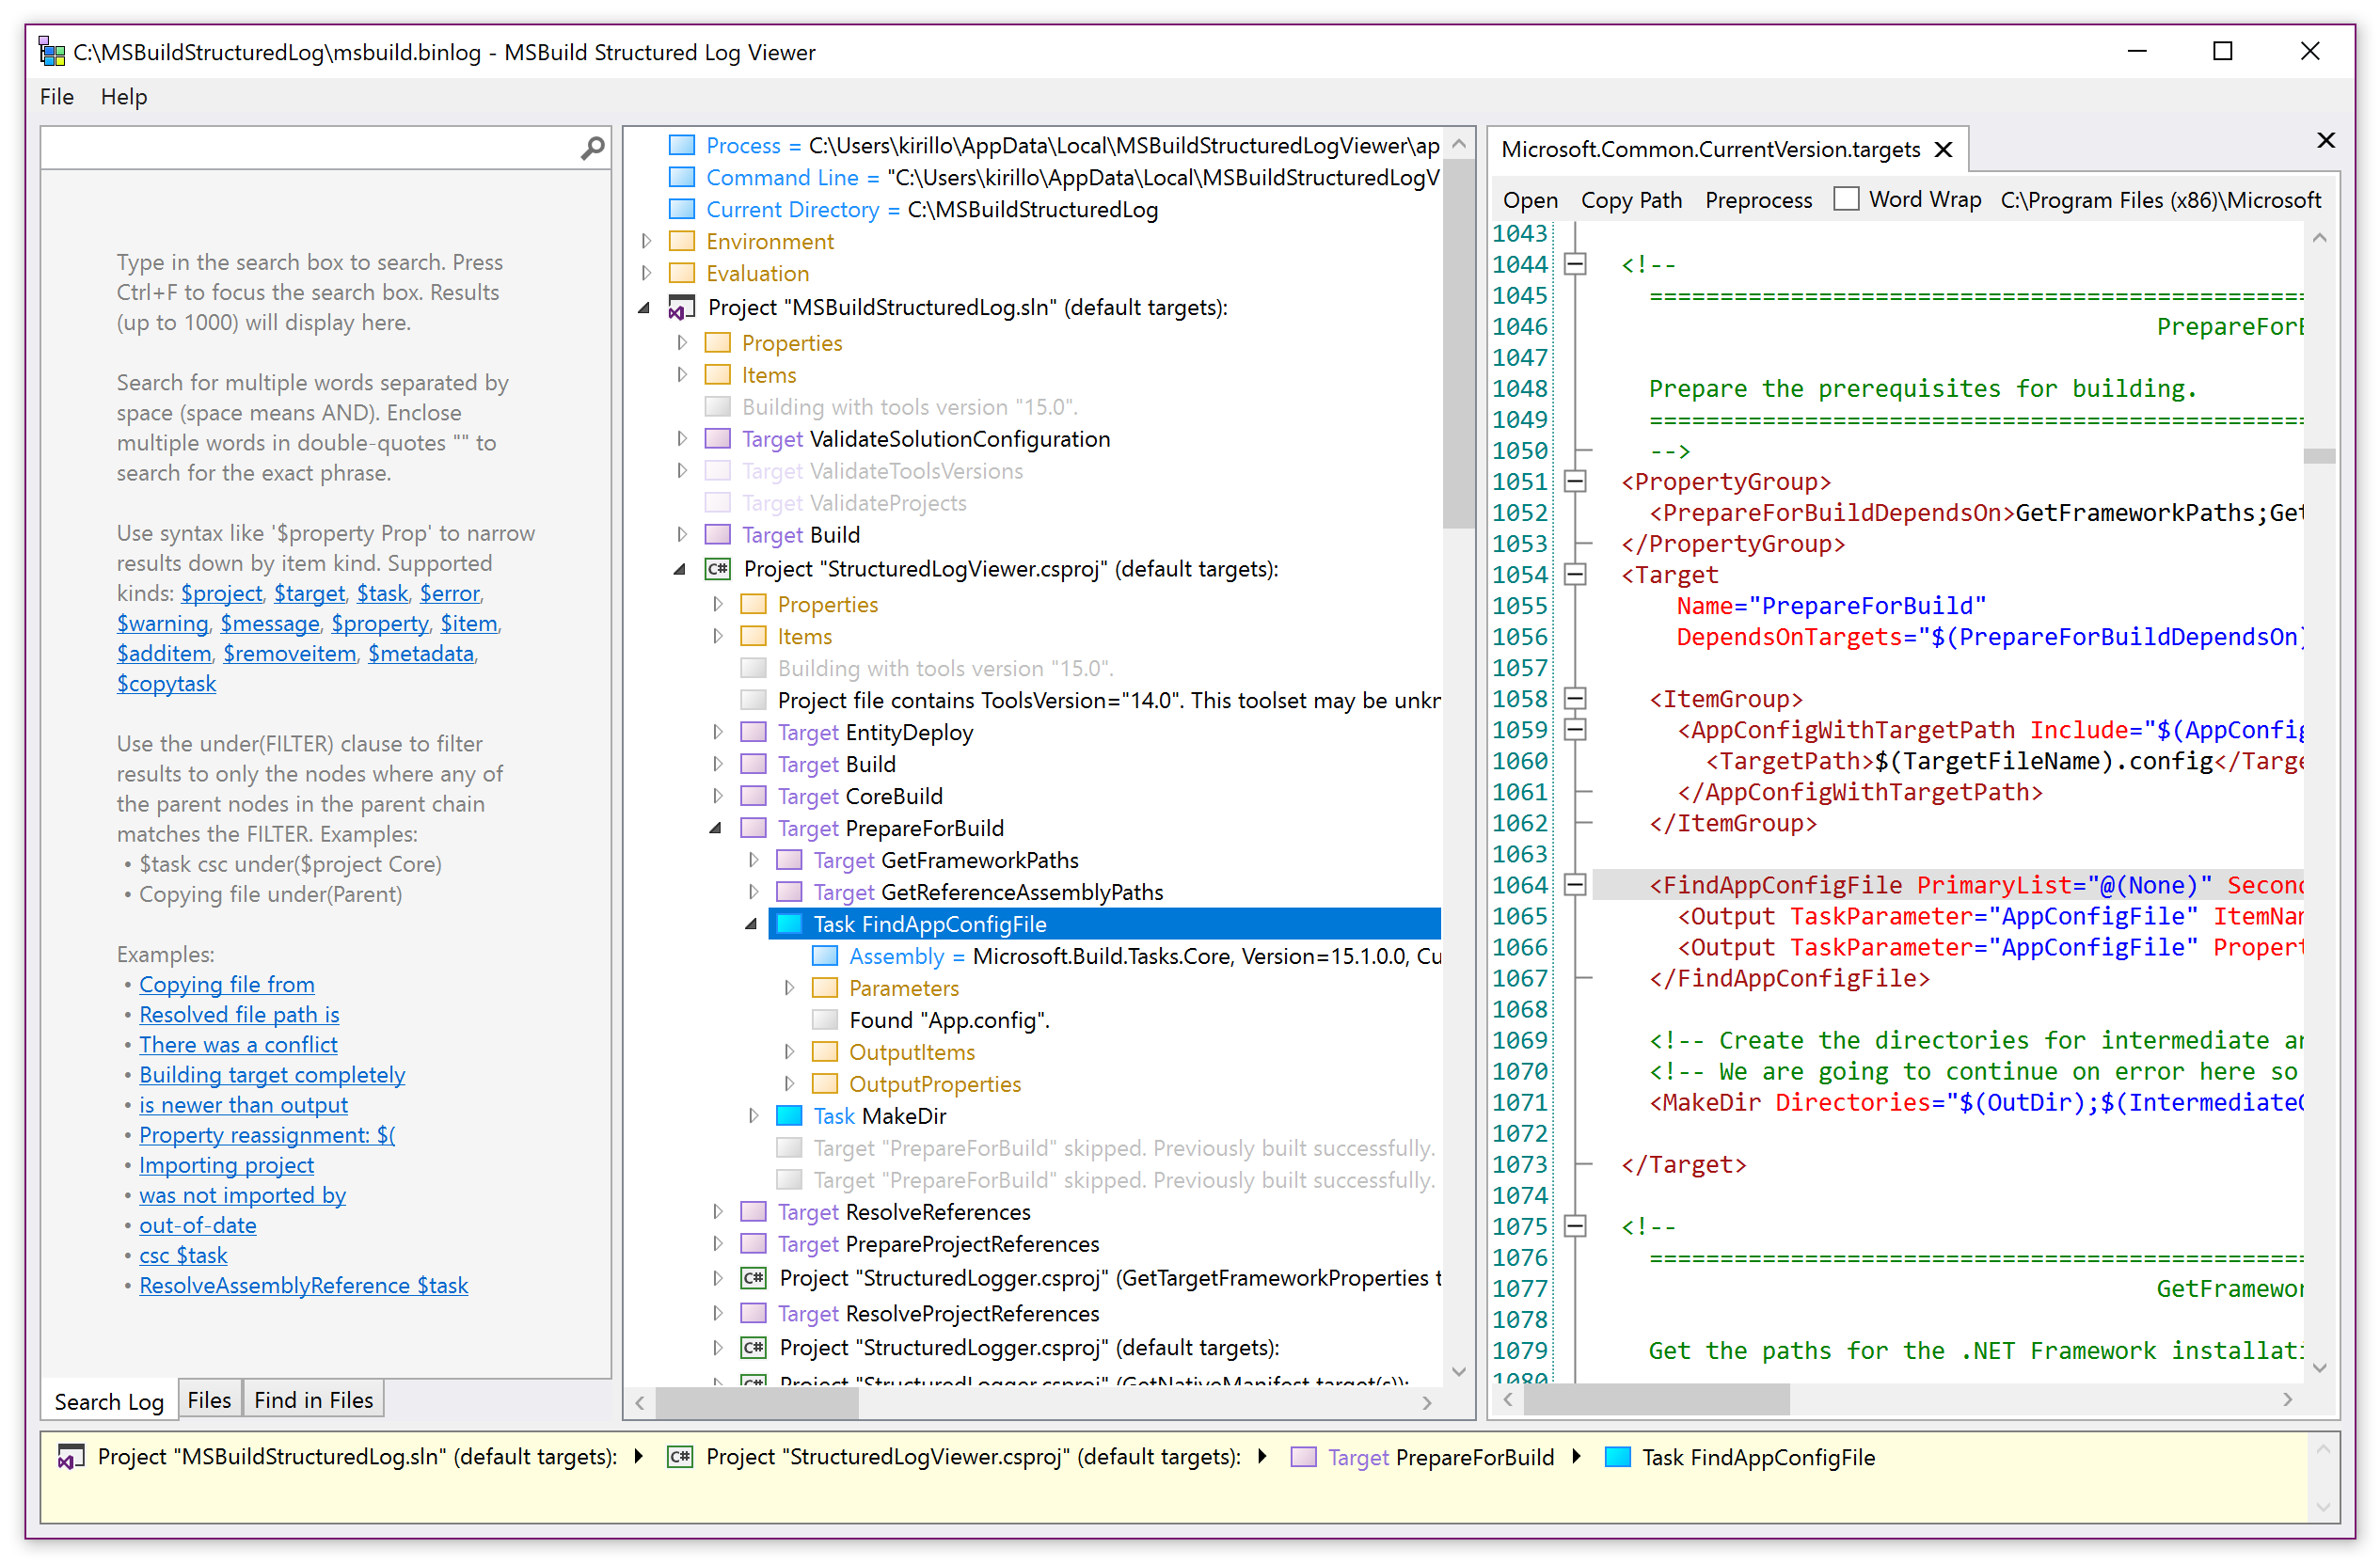
MSBuild Structured Log Viewer
More recently, Kirill Osenkov pointed me to MSBuild Structured Log Viewer.
MSBuild 15.3 onwards lets you dump the full log it produces into a binary file you can read with that viewer. This includes project-target-task hierarchies, clicking on a target to see its definition in code and a great search tool. You can even replay a build by feeding that same binary file to MSBuild in case you want to do something with it!
I encourage you to give it a try! This tool shares one of the principles with the one we’ll talk about in the next post in the series, so it feels very familiar to me!
C++ Build Insights
This one is even more recent, available from Visual Studio 2019 according to Kevin’s blog post on the official C++ developers blog.
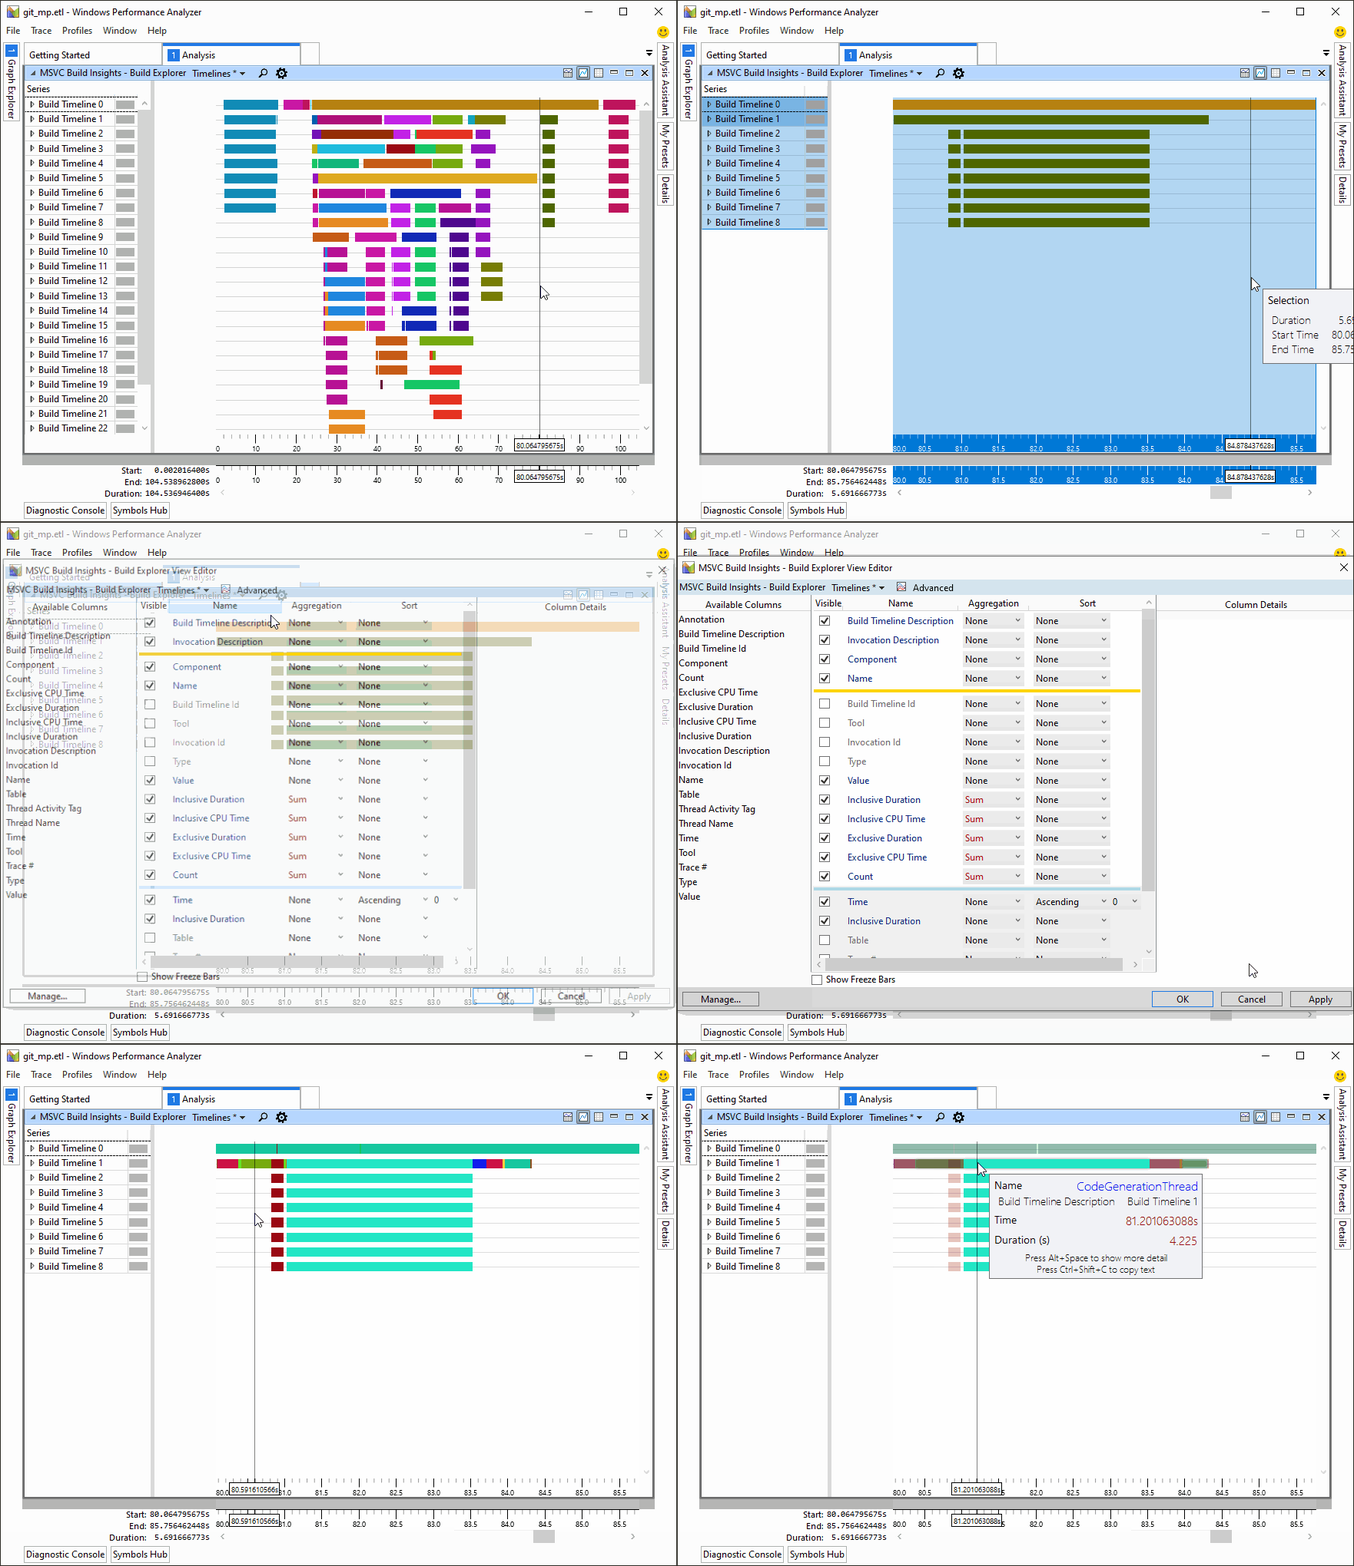
To put it simply, the new versions of MSVC compiler and linker emit ETW events and they’ve added specially tailored panels to the WPA so you can explore them. This means you’ll get exact timestamps, which is awesome when you want to investigate!
And even more, Kevin shared this post not even a month ago with the release of an SDK to help you build your own tools on top of that info! This looks like the tool I was looking for, so thank you for the release!
At the time of writing, you need to register to the Windows Insider Program to get the latest version, but it’s a quick process. Have a try and build great tools with it!
After a couple of years investigating these build times it’s very possible I forgot about some tool or compiler flag, but this was more or less my process.
We’ve mentioned MSBuild several times. We talked about targets and tasks. Further investigation led me to building my own tool so we can get a flame graph out of MSBuild! Visualizing data in a graphical may be key! That will be the next post in the series.
Thank you for reading, hope some of these tools help you!
Investigating C++ compile times
- My journey investigating slow compile times in C++
- Useful tools to investigate C++ compile times
- Understanding MSBuild to create flame graphs
- Improving C++ compile times using flame graphs
- Getting data from C++ Build Insights SDK

