My journey investigating slow compile times in C++
Investigating C++ compile times
- My journey investigating slow compile times in C++
- Useful tools to investigate C++ compile times
- Understanding MSBuild to create flame graphs
- Improving C++ compile times using flame graphs
- Getting data from C++ Build Insights SDK
You know what’s boring? Processes that take long to complete without you interacting. Making some coffee? I want it already! Doing the laundry? If only it didn’t take hours! Riding a slow elevator? Please, c’mon!
The only good thing about these processes taking long is being able to do something else in the meantime. And you better don’t repeat them very otften!
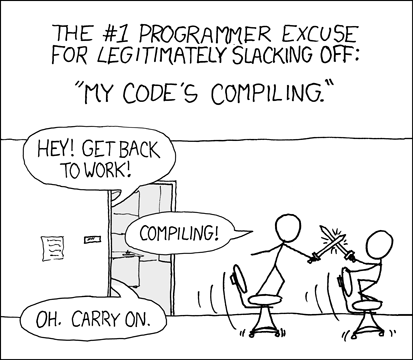
Programmers repeat one thing way too many times a day: building the project they’re working on. And chances are you’ve come across this awesome webcomic:
Yeah, at first you may smile and think hey, it’s funny. However, when that happens several times a day you start thinking oh, not again instead.
This isn’t a pathology for a single language, platform or business: you may be a game programmer whose project takes several minutes to build (and some more to run!), or a front-end developer whose packaging and deployment process lets you have breakfast while it finishes or you may have some kind of asset in your project you need to process and wish you didn’t need to.
Motivation
I’ve been worrying about slow build times lately. Like, for the last couple of years.
Profiling processes isn’t alien to programmers, sometimes you need to know why something is slow. However, it’s less common to profile build or deployment processes (and we repeat them very often!).
Slow build times cause frustration and discourage both architecture and feature iteration: if I modify this file I get a full rebuild, so I better not touch it. This costs your company increasing amounts of money: people aren’t creating new stuff or improving your systems, and they aren’t happy.
Since I started worrying about these anomalistic build times I’ve tried to learn what kind of things can cause them. I’ve read about ways to investigate them. Found some great tools, used them in our projects, built my own tools. Most of the stuff I’ve studied matches my main development environment: Visual Studio running on Windows, compiling C++ projects with MSVC.
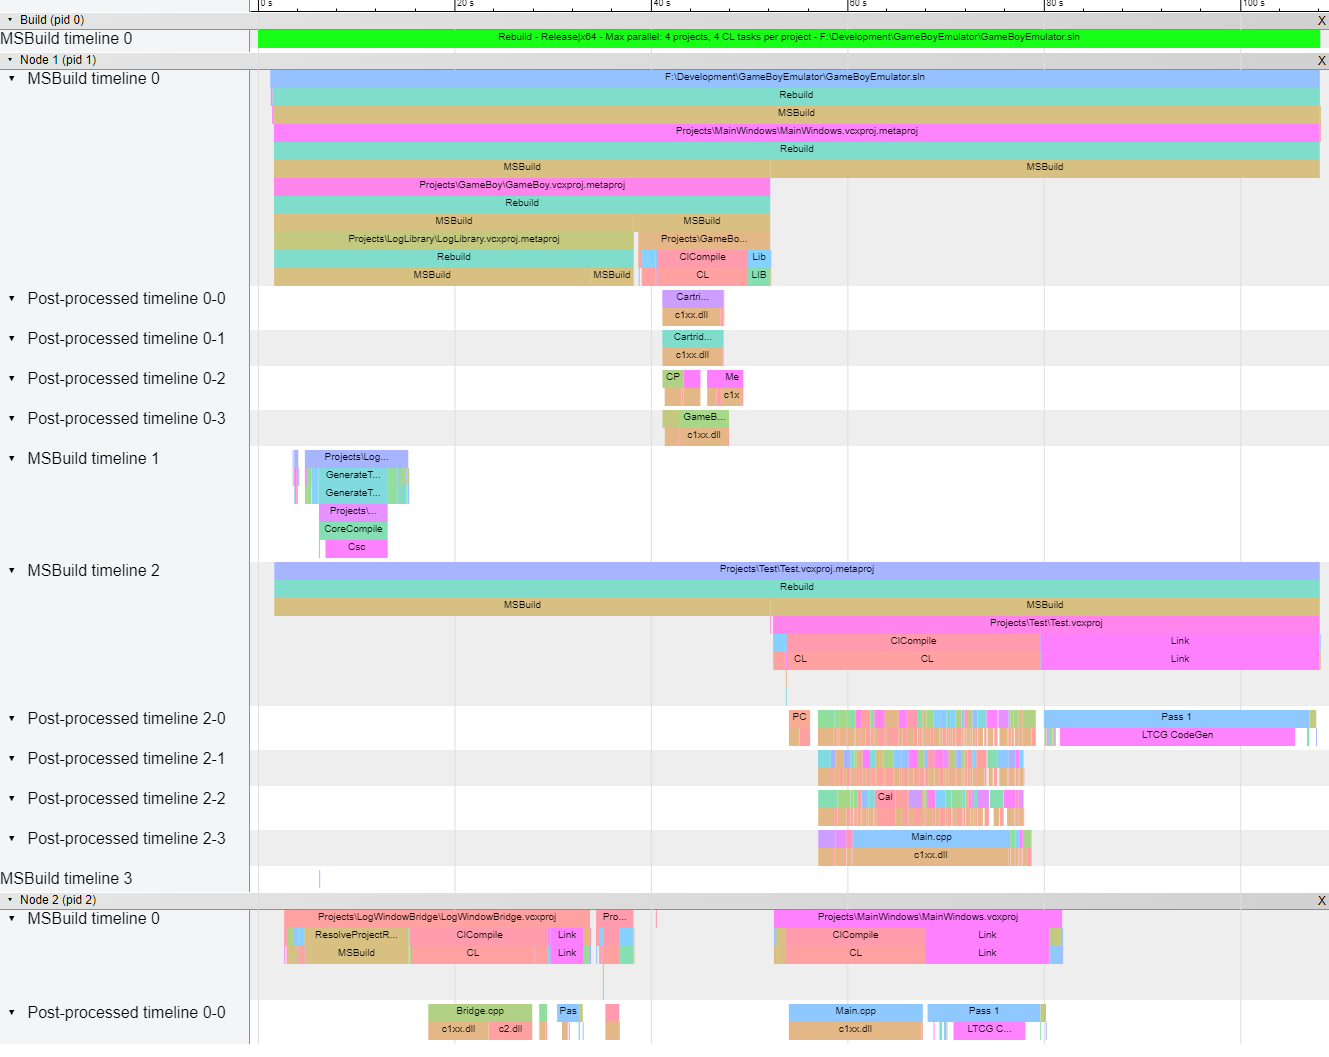
In this series I’d like to share what I’ve learned in the process, including some of those tools or how I’ve used them. Finally, I also want to talk about a way to visualize MSBuild’s build process using Google Chrome’s trace viewer and how it helped me. Have a look at a teaser:

To make this tool, I was inspired by @aras_p from this blog post.
Thank you, Aras!
Disclaimer
Unfortunately, this isn’t a series about how to speed up your compile times, that’s a series on its own. Instead, I want to share what I’ve learned while investigating slow compile times: how MSBuild deals with solutions and projects, how to configure Visual Studio to add extra data or how some MSVC compiler flags can give you a heads up on your development cycle.
You know, the first step when optimizing something is to get some metrics we can compare with, or else we couldn’t know whether it improved. In our case, one question that needs an answer is: how long do the different steps in our build process take?
But first, try to give an estimate to this:
How much time you think you waste waiting for your project to build, each day?
Investigating C++ compile times
- My journey investigating slow compile times in C++
- Useful tools to investigate C++ compile times
- Understanding MSBuild to create flame graphs
- Improving C++ compile times using flame graphs
- Getting data from C++ Build Insights SDK

